
Welcome back! I’m continuing a series on income inequality. In part 1 of this series, I argued that the fiscal conservative stance is an ethical stance, not simply an economic one. I argued that it does more harm than good. That is, fiscal conservative policies hinder the wellbeing of persons. In this post, I’m going to use quite a bit of data with two purposes, (1) I want to simply show how different democratic countries stack up with respect to many social goods, and (2) I want to convince you that inequality does more harm than good.
As a reminder, the fiscal conservative is definitely committed to the following three claims:
- We ought to balance the budget. The government should not be spending more than it takes in.
- Any new spending ought to be supported with current revenue, and not through borrowing.
- The method for balancing the budget ought to be to reduce spending rather than raising taxes.
Fiscal conservatives are often, though not necessarily, in favor of the following principles:
- We ought to have a laissez-faire economy with limited regulation by the government.
- We should have a small central government with more control given to individual states.
- We ought to have lower taxes for everyone; a fiscal conservative will rarely vote to raise taxes for any reason.
- We ought to reform the welfare system, i.e., dramatically cut spending on welfare programs.
Then, the fiscal liberal would think more or less the opposite. She believes we may balance the budget by raising taxes on the super wealthy (while agreeing that we ought to balance the budget), we should have a strong federal government that ought to regulate corporations, and the government ought to actively support those less fortunate.
In order to show that inequality has a worse effect on individuals’ wellbeing, I need to go through quite a bit of data. I need to show how measures of wellbeing such as infant mortality correlate with inequality, on the one hand, versus wealth on the other. Bear with me as we sift through the numbers.
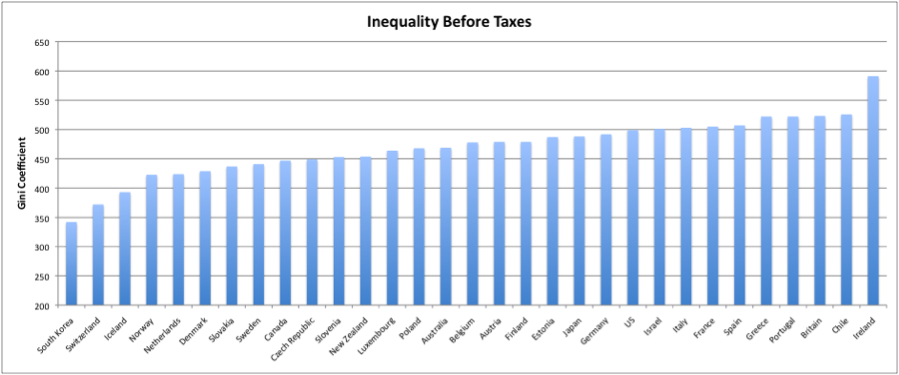
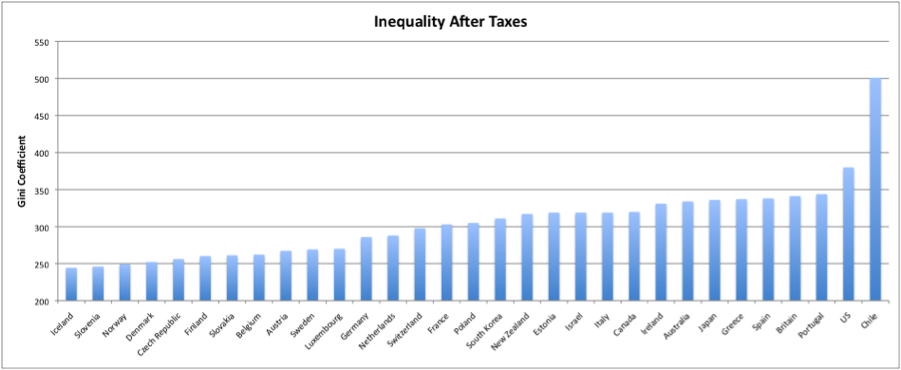
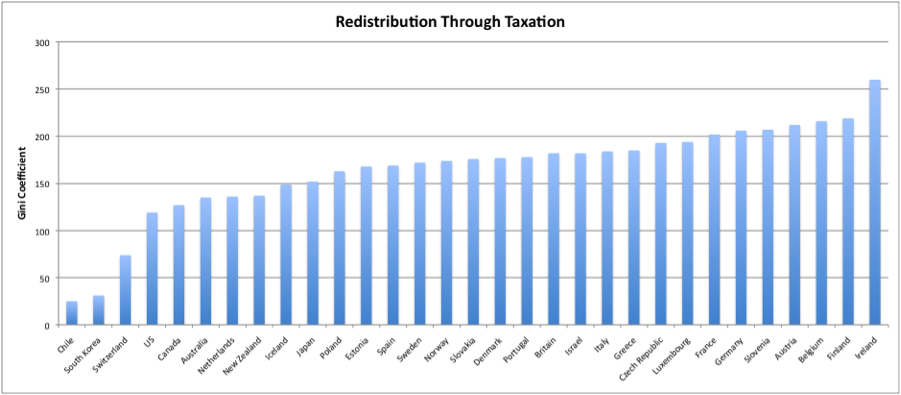
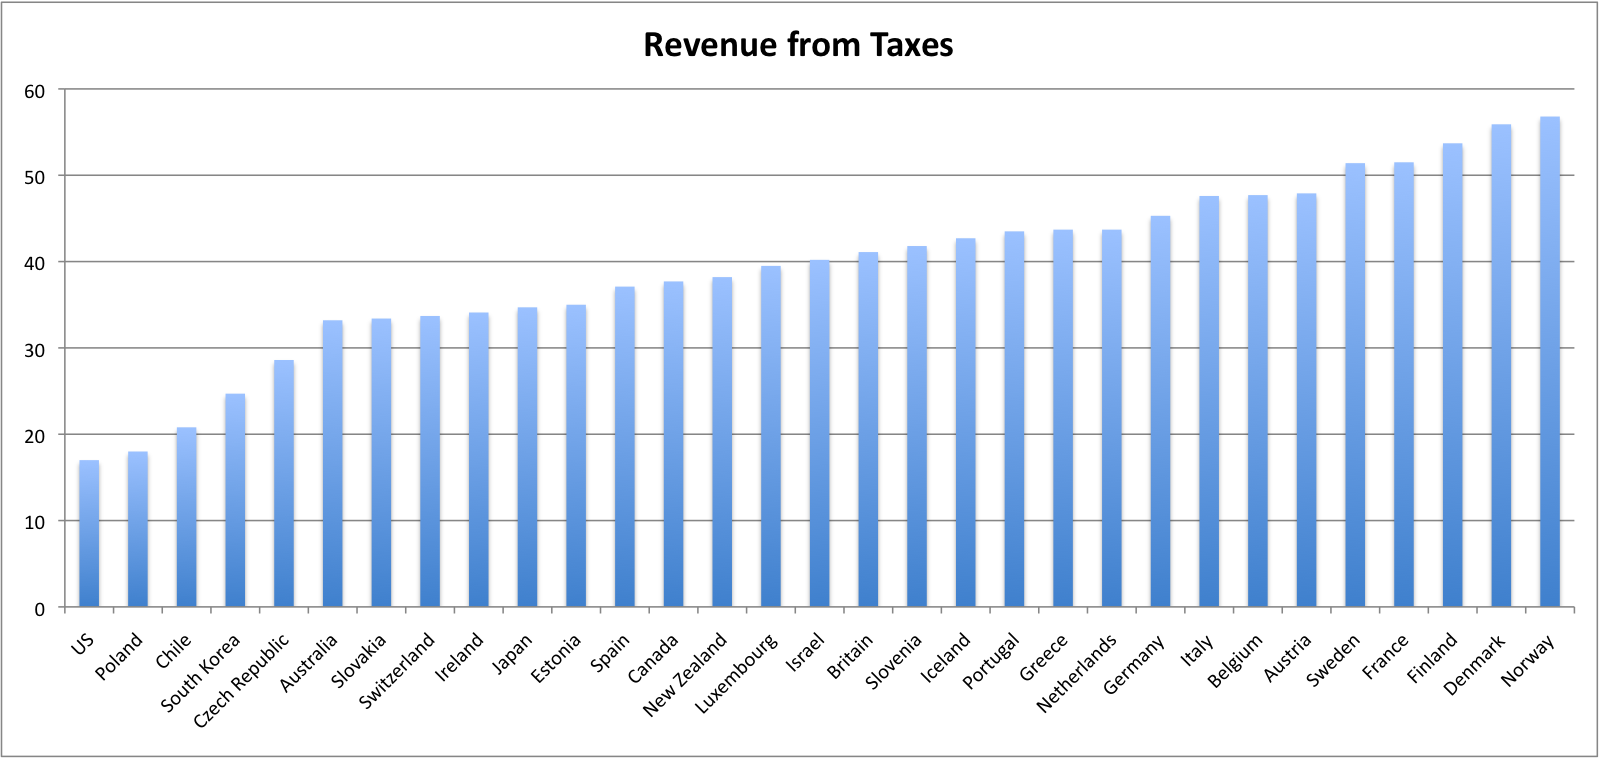
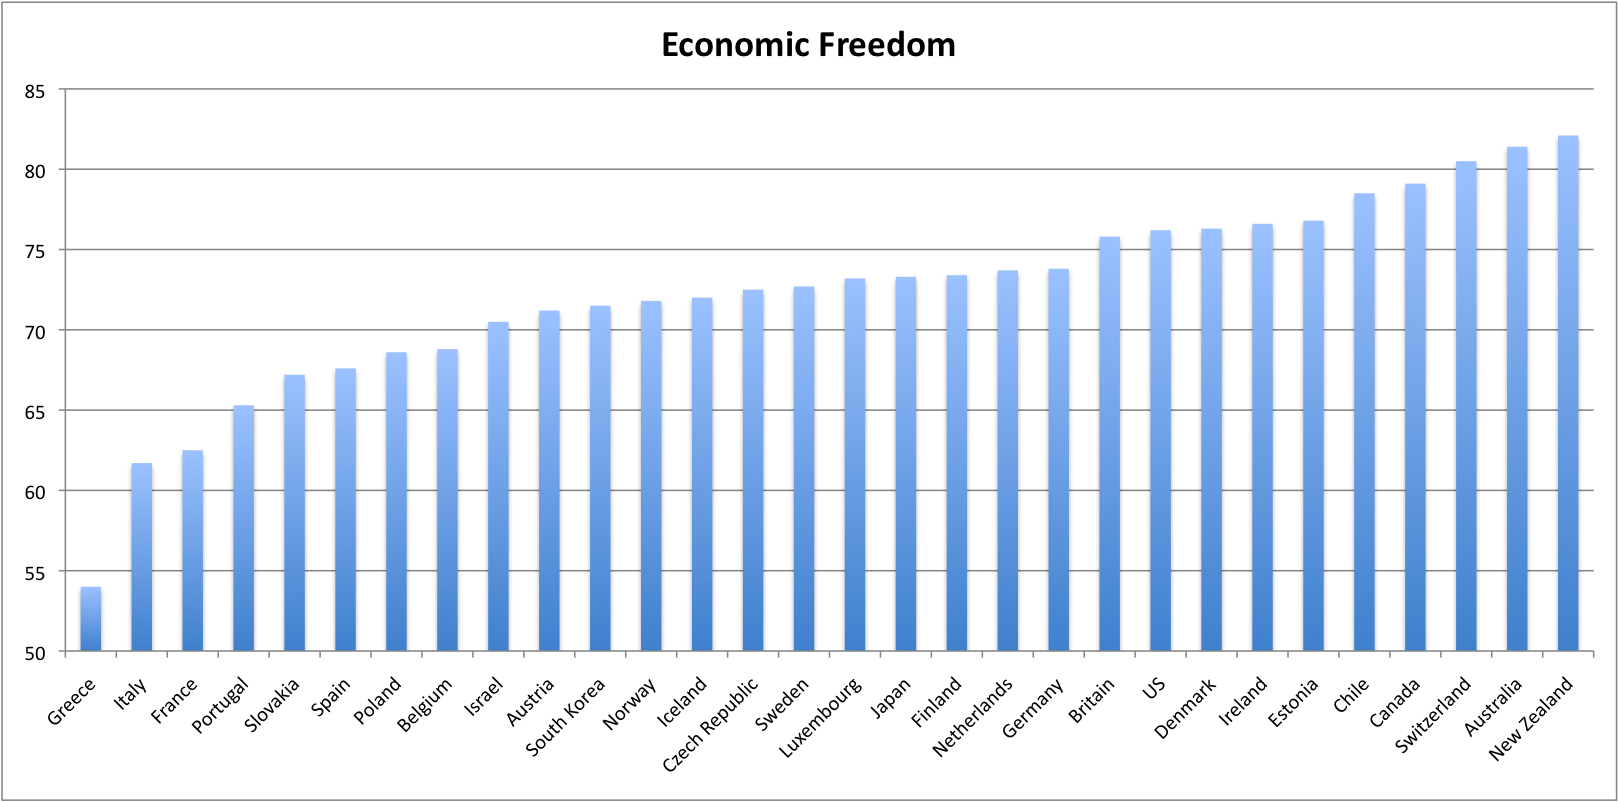
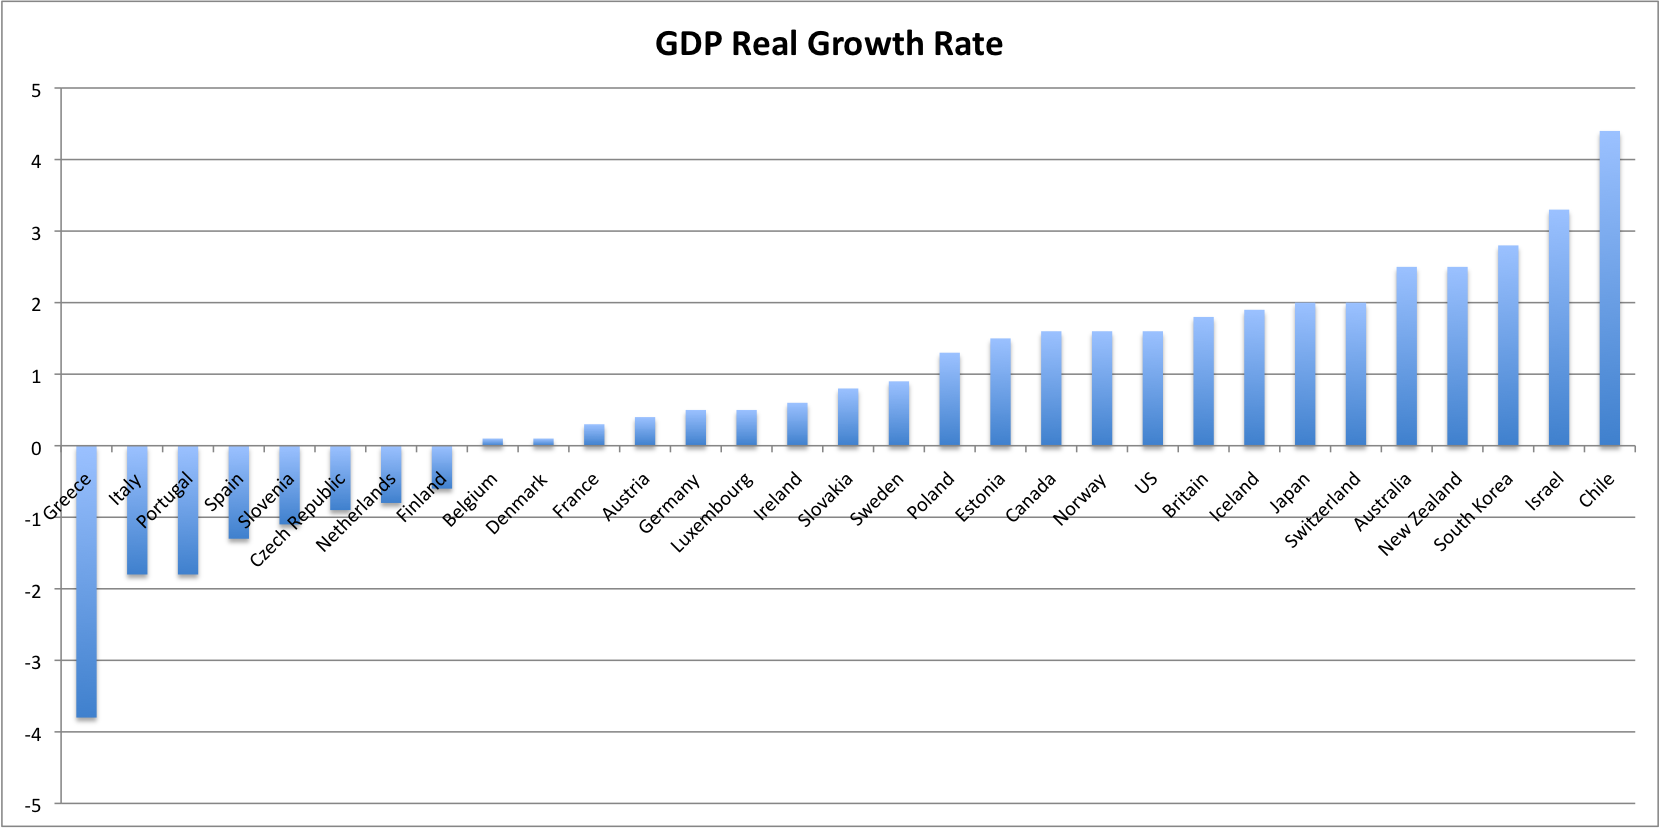
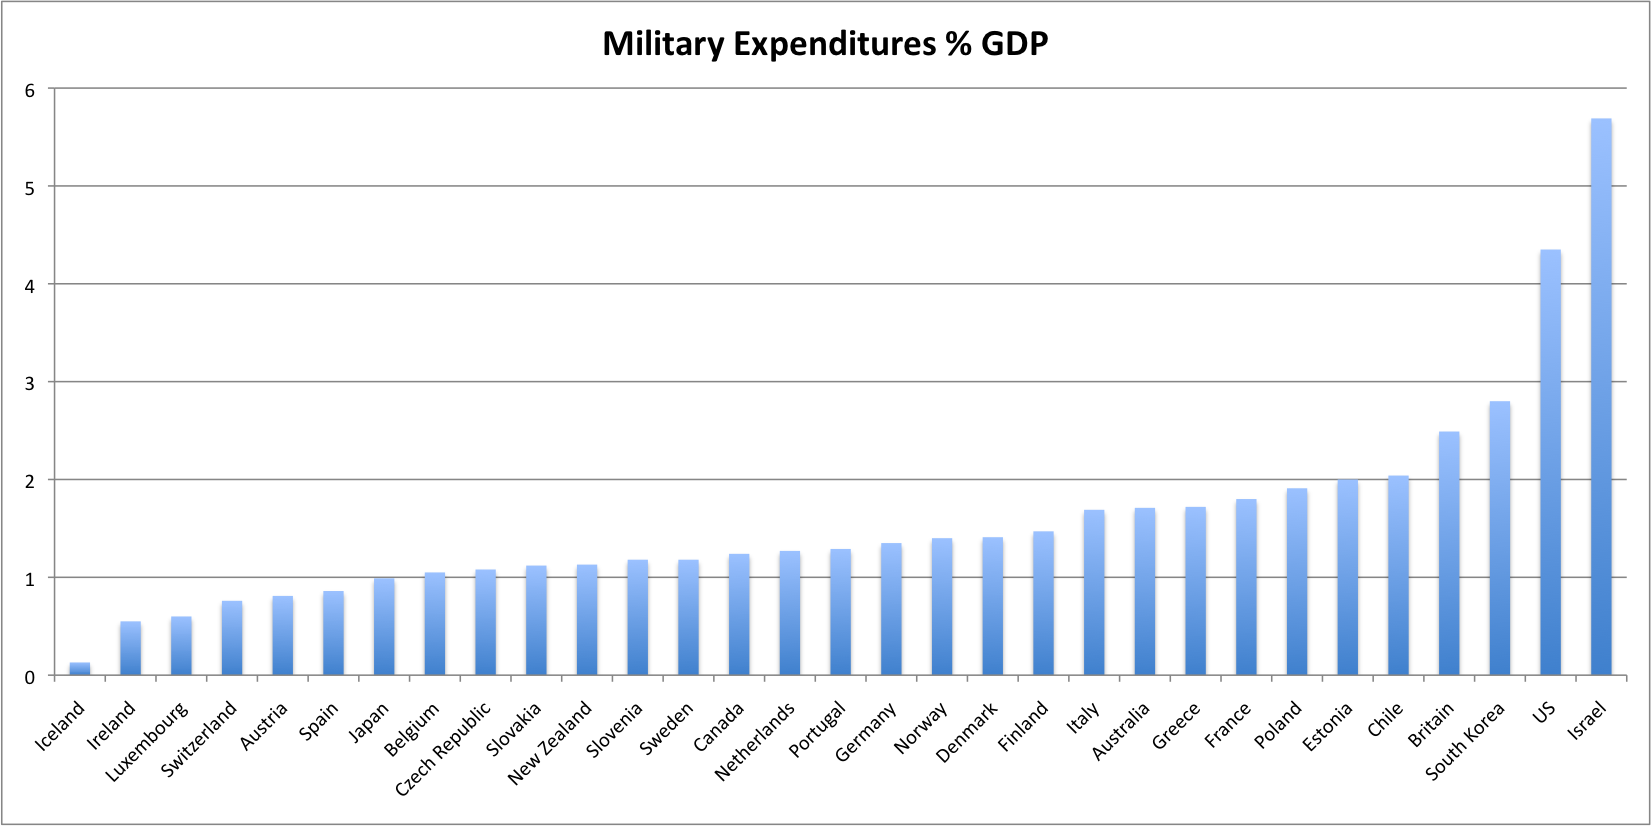
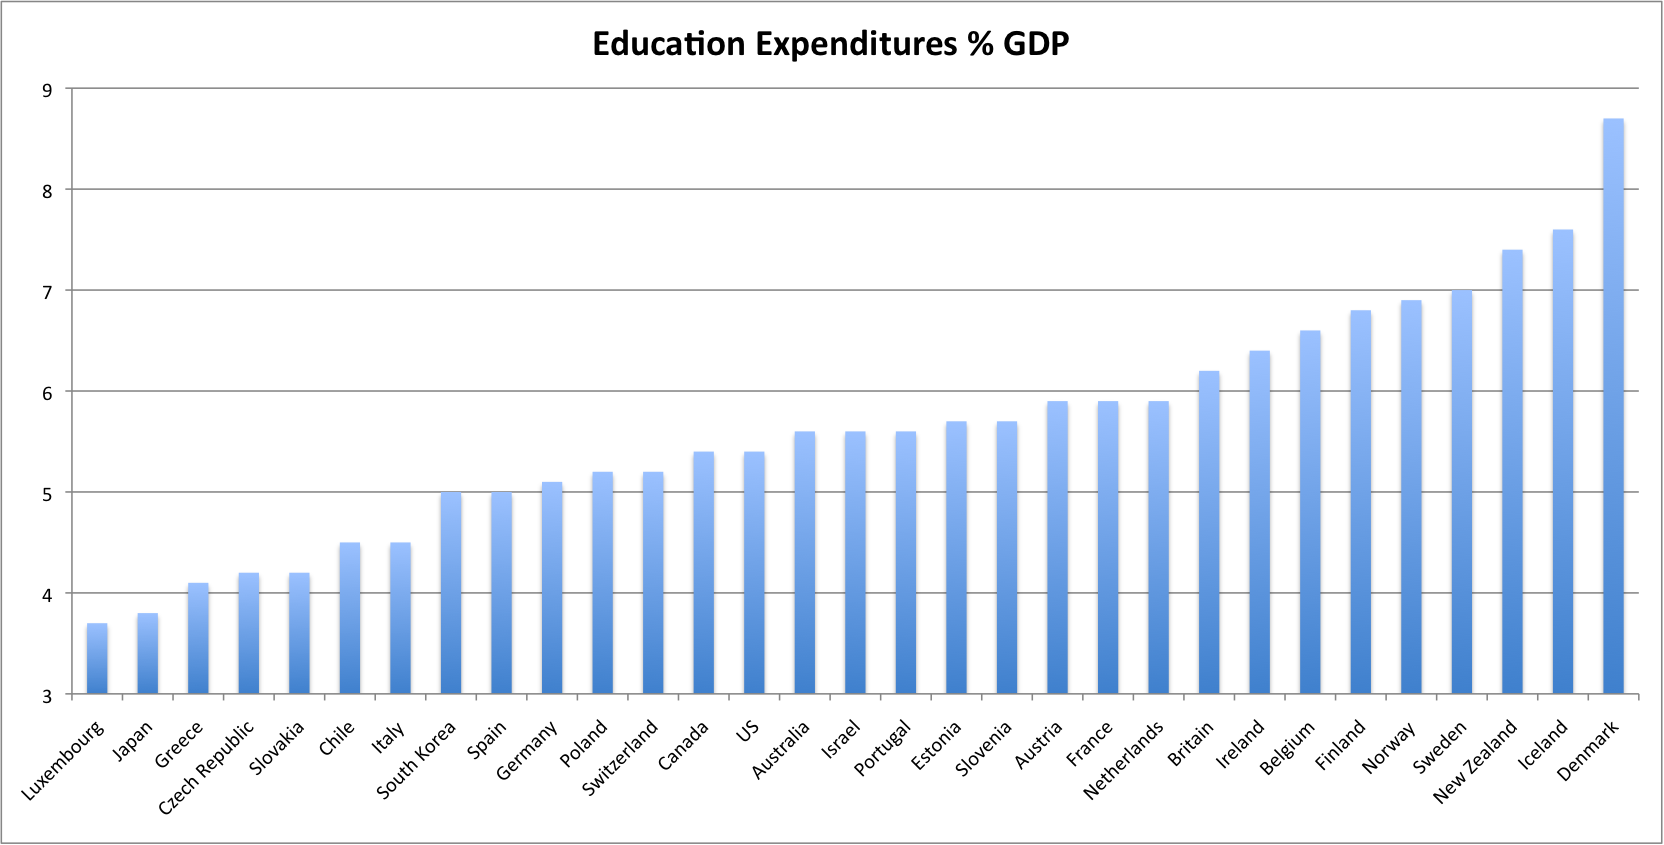
I’ve compiled a massive spreadsheet with the following information for all 31 OECD countries. Click on the graph to see greater detail.
- Inequality before taxes (Gini Coefficient)
- Inequality after taxes (Gini Coefficient)
- Redistribution (inequality before taxes minus inequality after taxes)
- Taxes (Taxes and other revenues records total taxes and other revenues received by the national government during the time period indicated, expressed as a percent of GDP. Taxes include personal and corporate income taxes, value added taxes, excise taxes, and tariffs.)
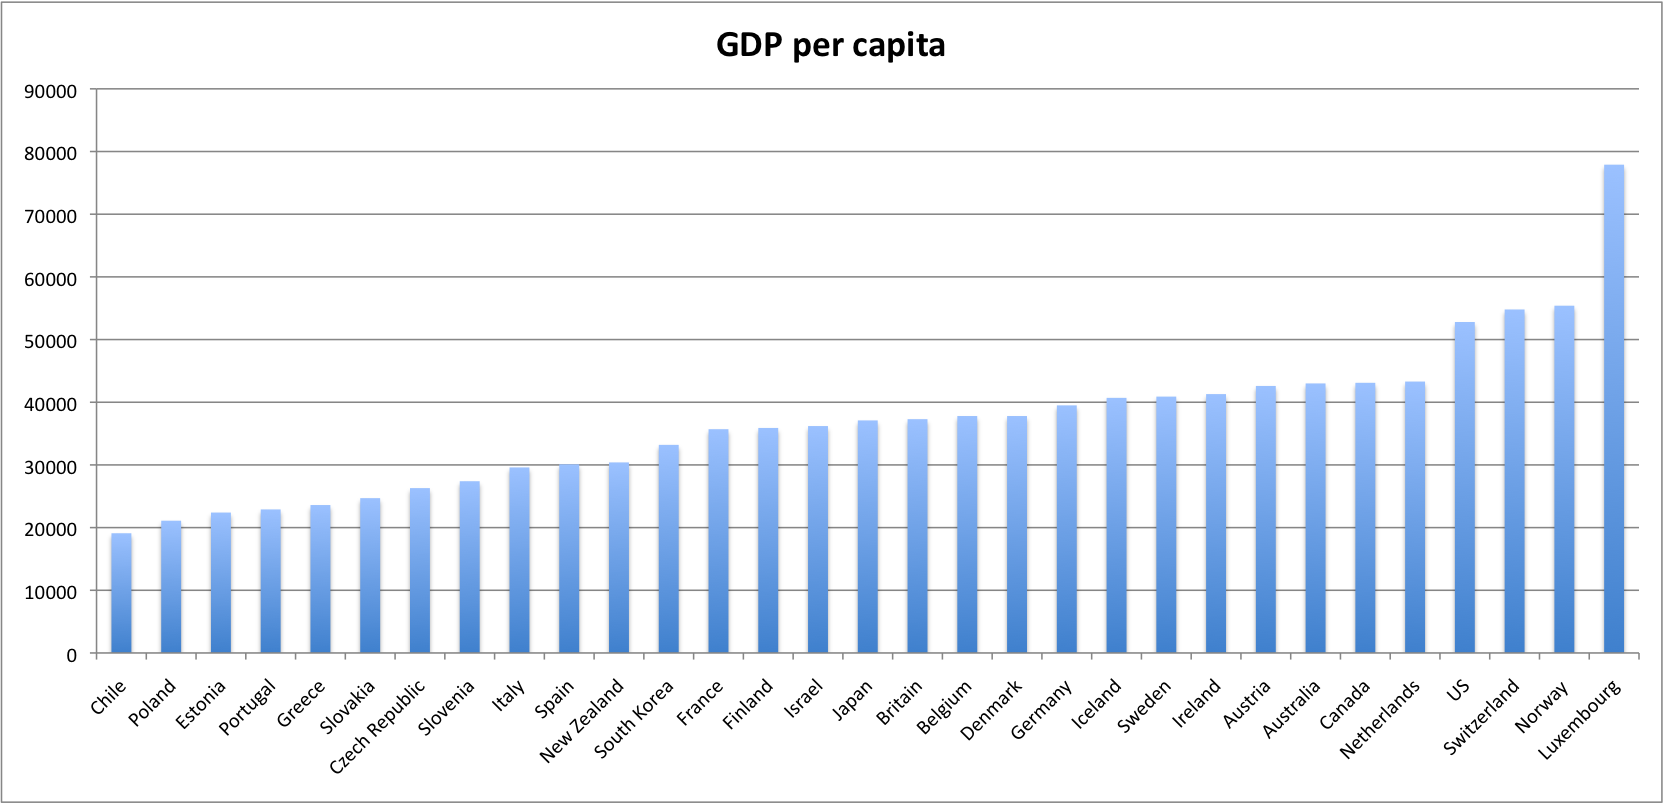
- GDP per capita (A measure of the total output of a country that takes the gross domestic product (GDP) and divides it by the number of people in the country).
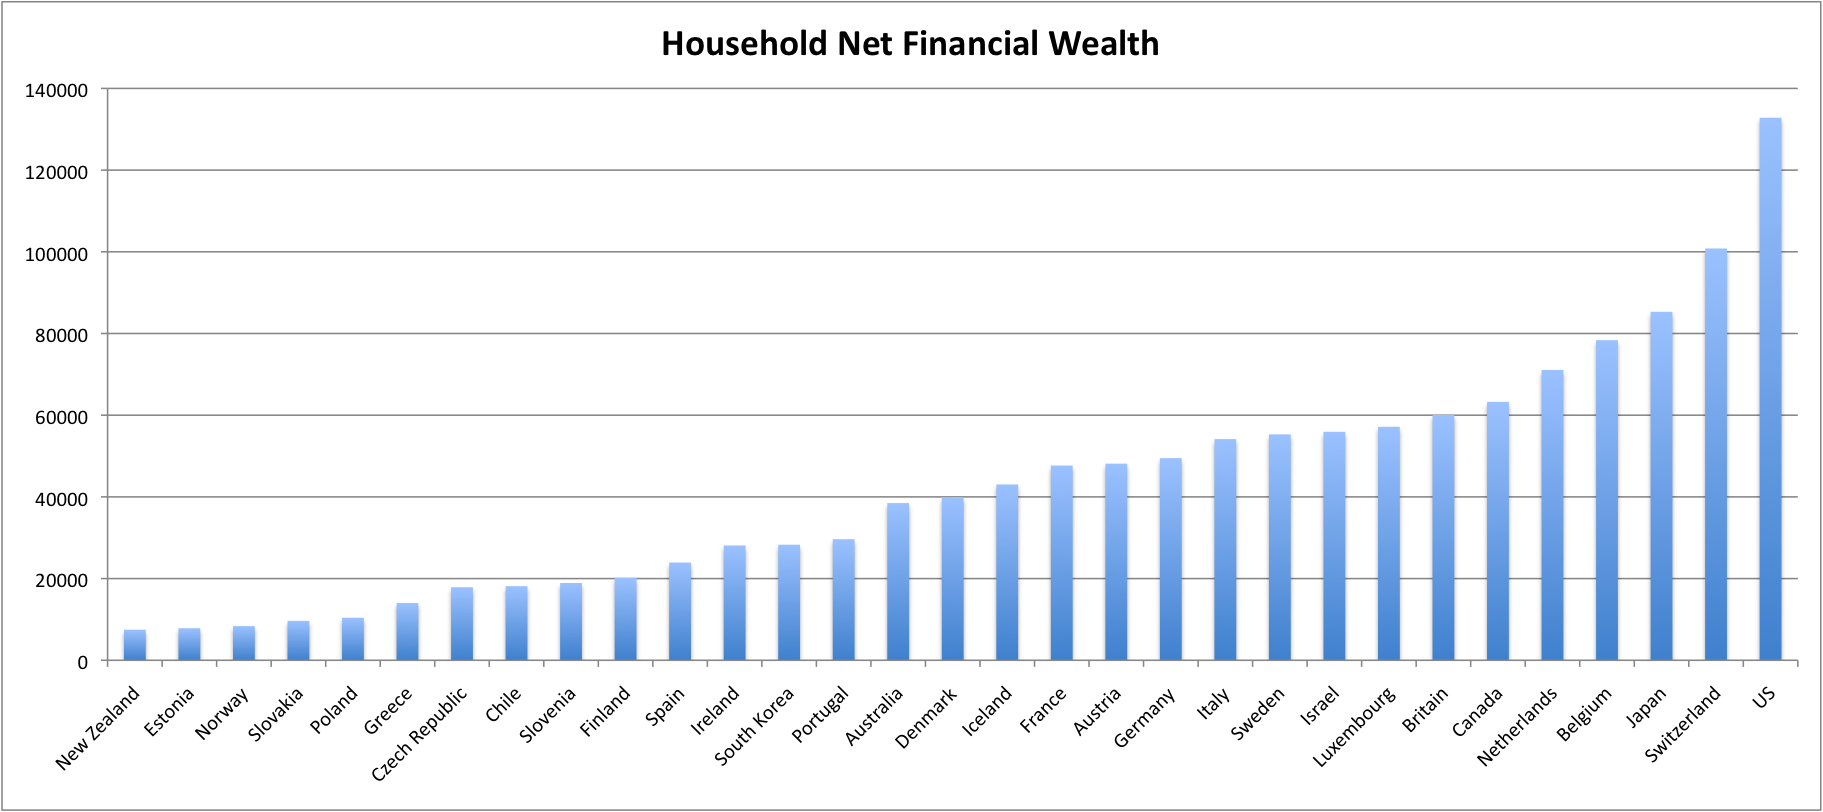
- Household Net Financial Wealth (the median of net wealth, which is assets minus liabilities).
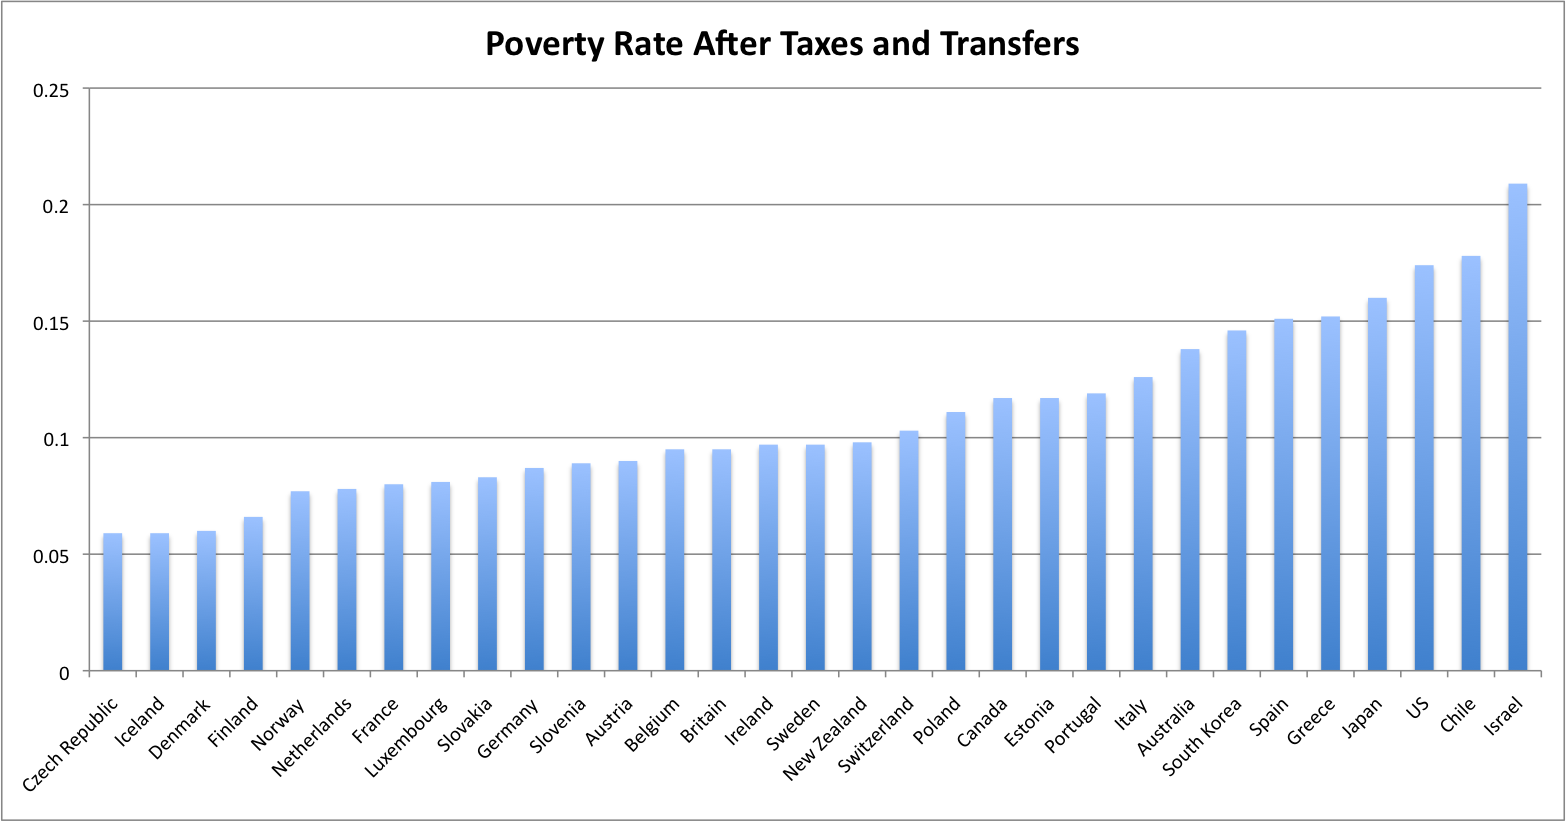
- Poverty (poverty rate after taxes and transfers, including safety net).
- Corruption (This is a score, out of 100, for how citizens perceive the corruption of their government. The higher the score, the better.)

- Economic Freedom (Economic freedom is the fundamental right of every human to control his or her own labor and property. In an economically free society, individuals are free to work, produce, consume, and invest in any way they please. In economically free societies, governments allow labor, capital, and goods to move freely, and refrain from coercion or constraint of liberty beyond the extent necessary to protect and maintain liberty itself.)
- GDP Real Growth (Annual percentage growth rate of GDP at market prices based on constant local currency.)
- Military Expenditures as a percentage of GDP
- Education Expenditures as a percentage of GDP
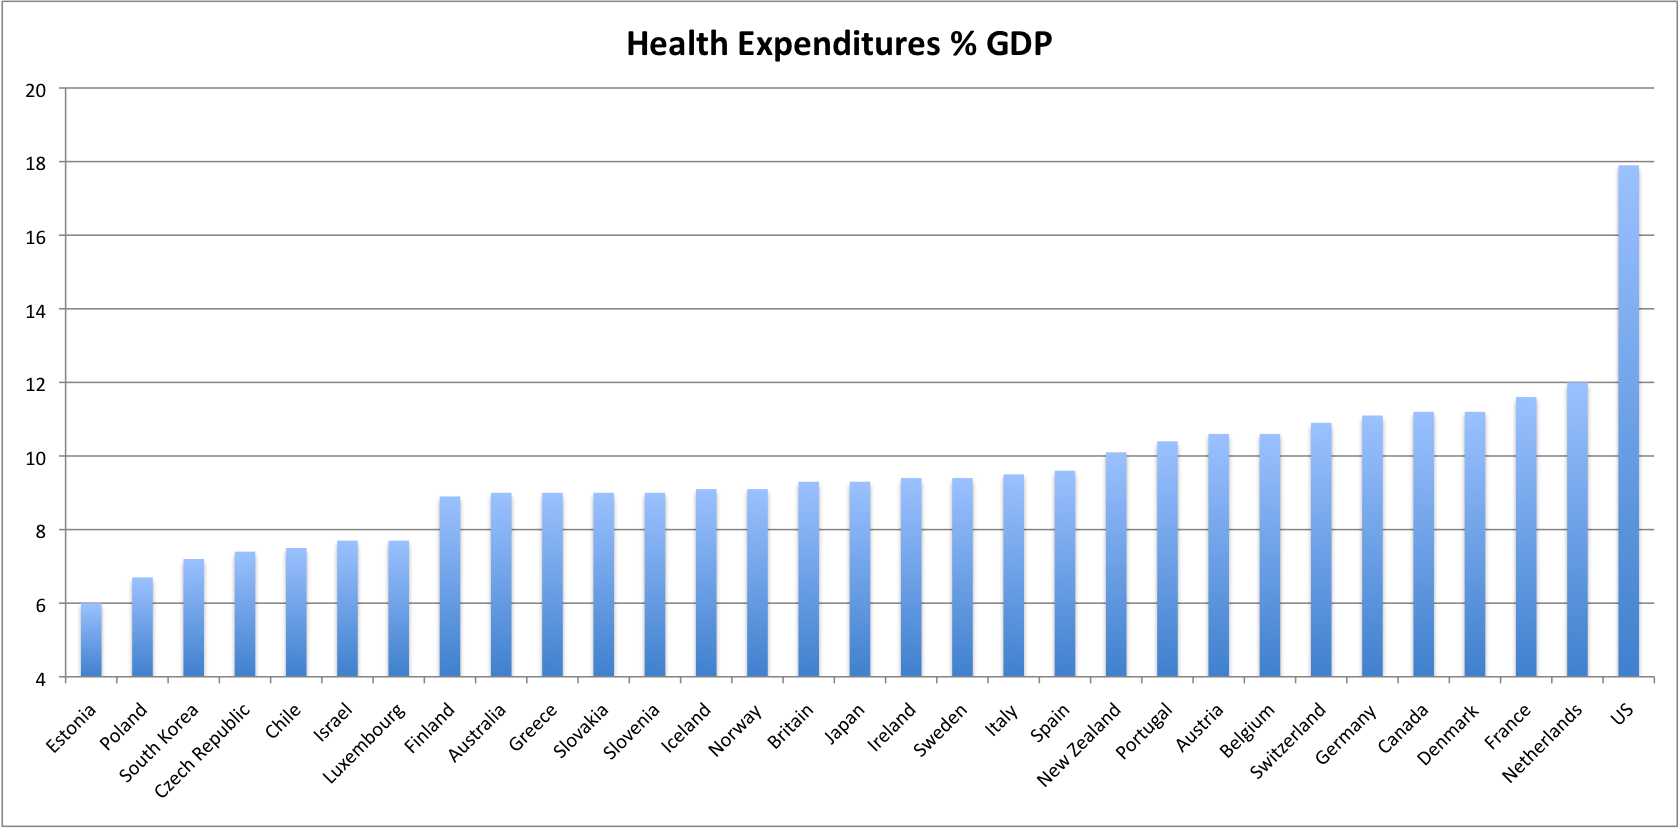
- Healthcare Expenditures as a percentage of GDP
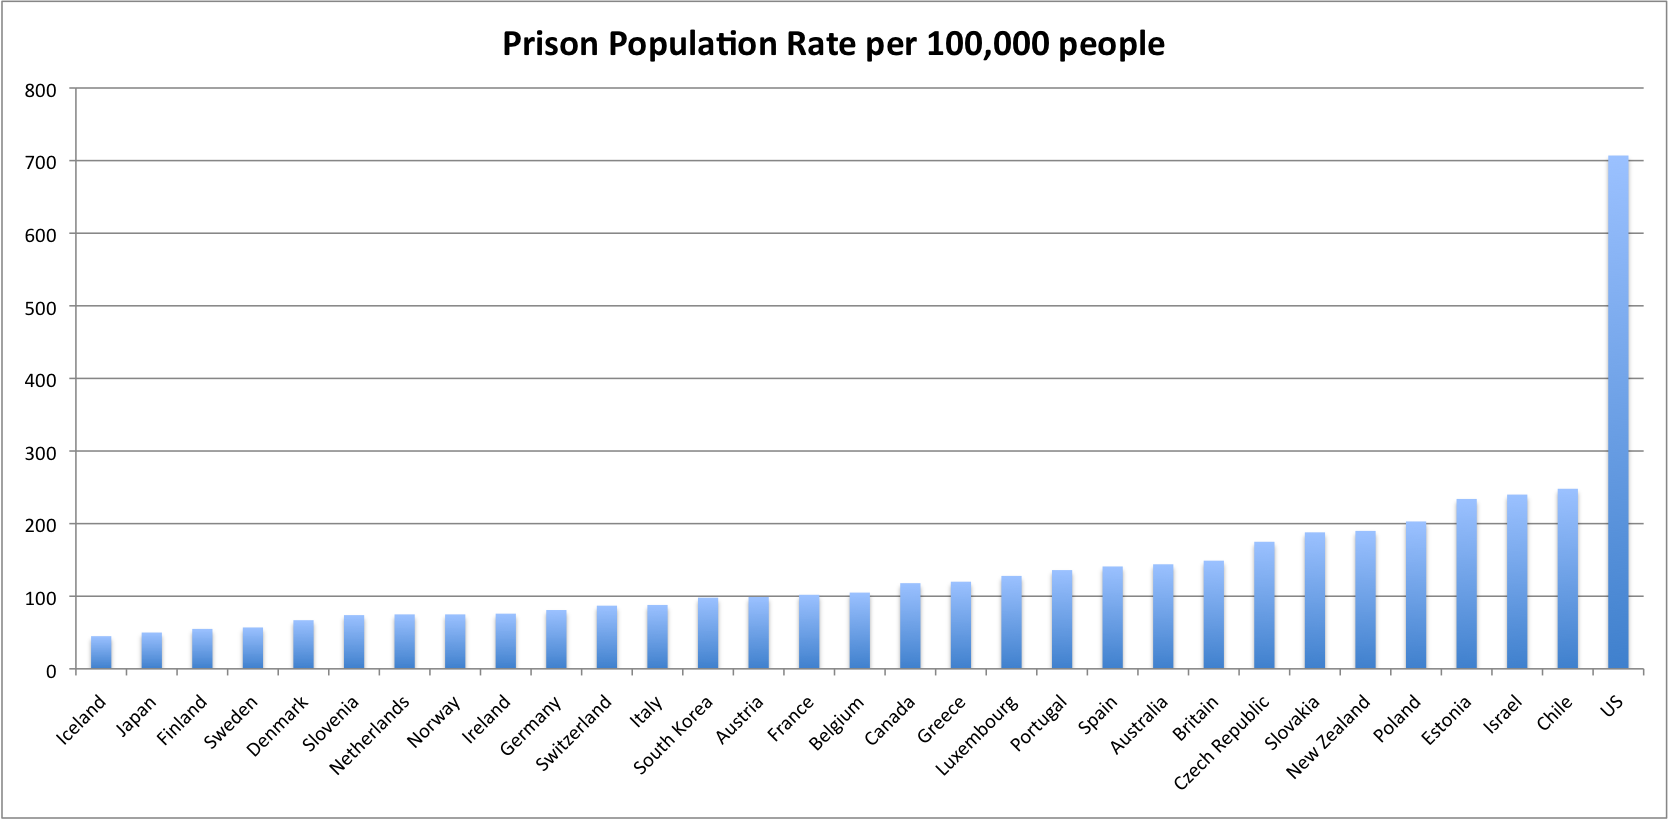
- Prison population per 100,000 residents
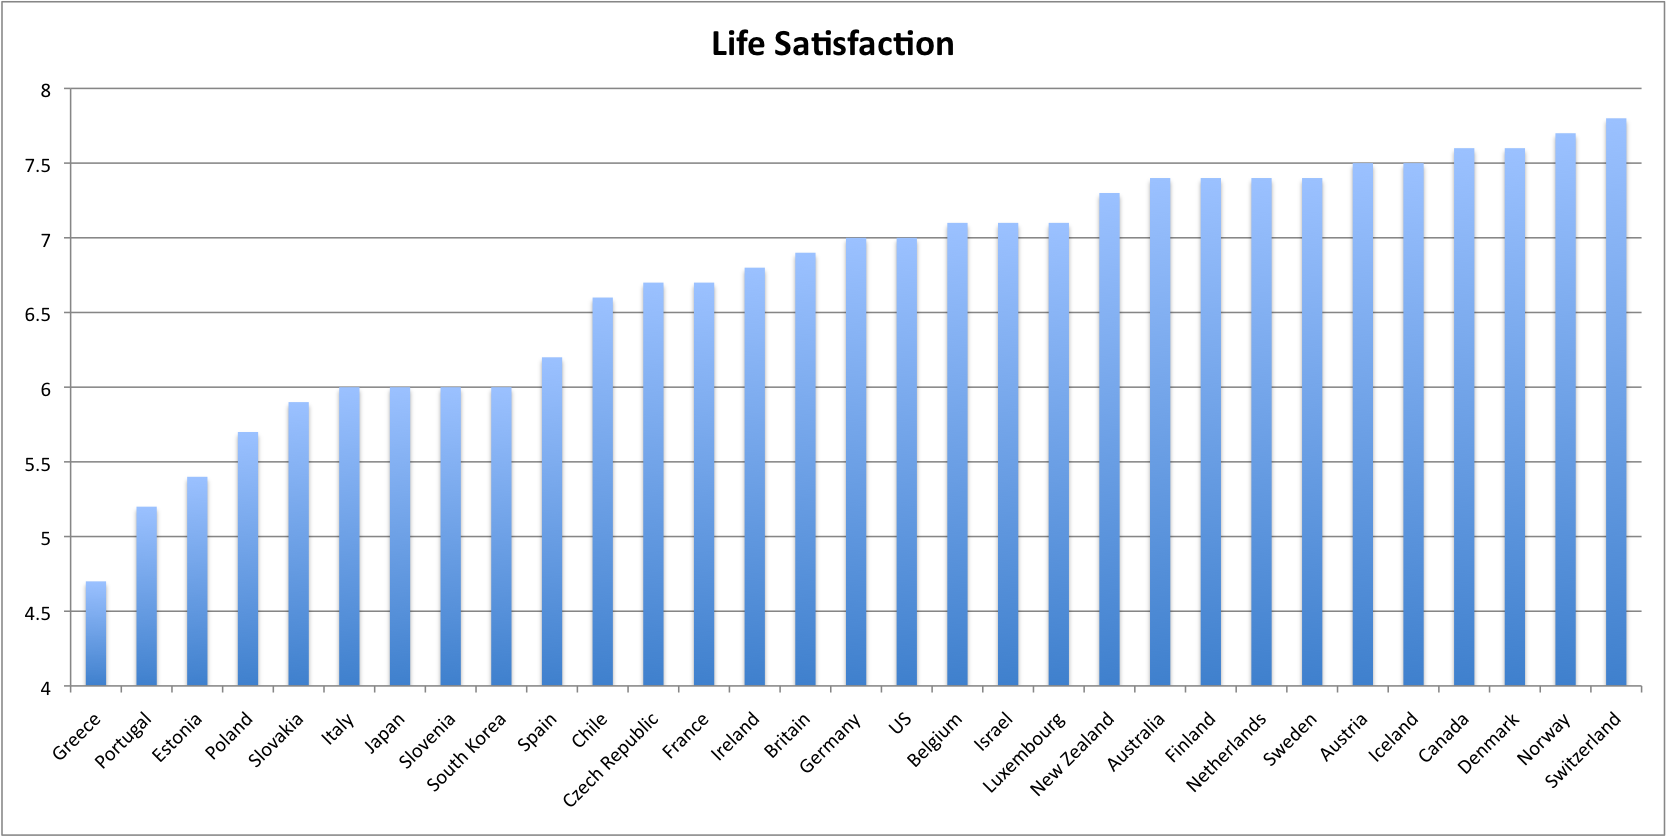
- Life Satisfaction (The indicator considers people’s evaluation of their life as a whole. It is a weighted-sum of different response categories based on people’s rates of their current life relative to the best and worst possible lives for them on a scale from 0 to 10, using the Cantril Ladder (known also as the “Self-Anchoring Striving Scale”).)
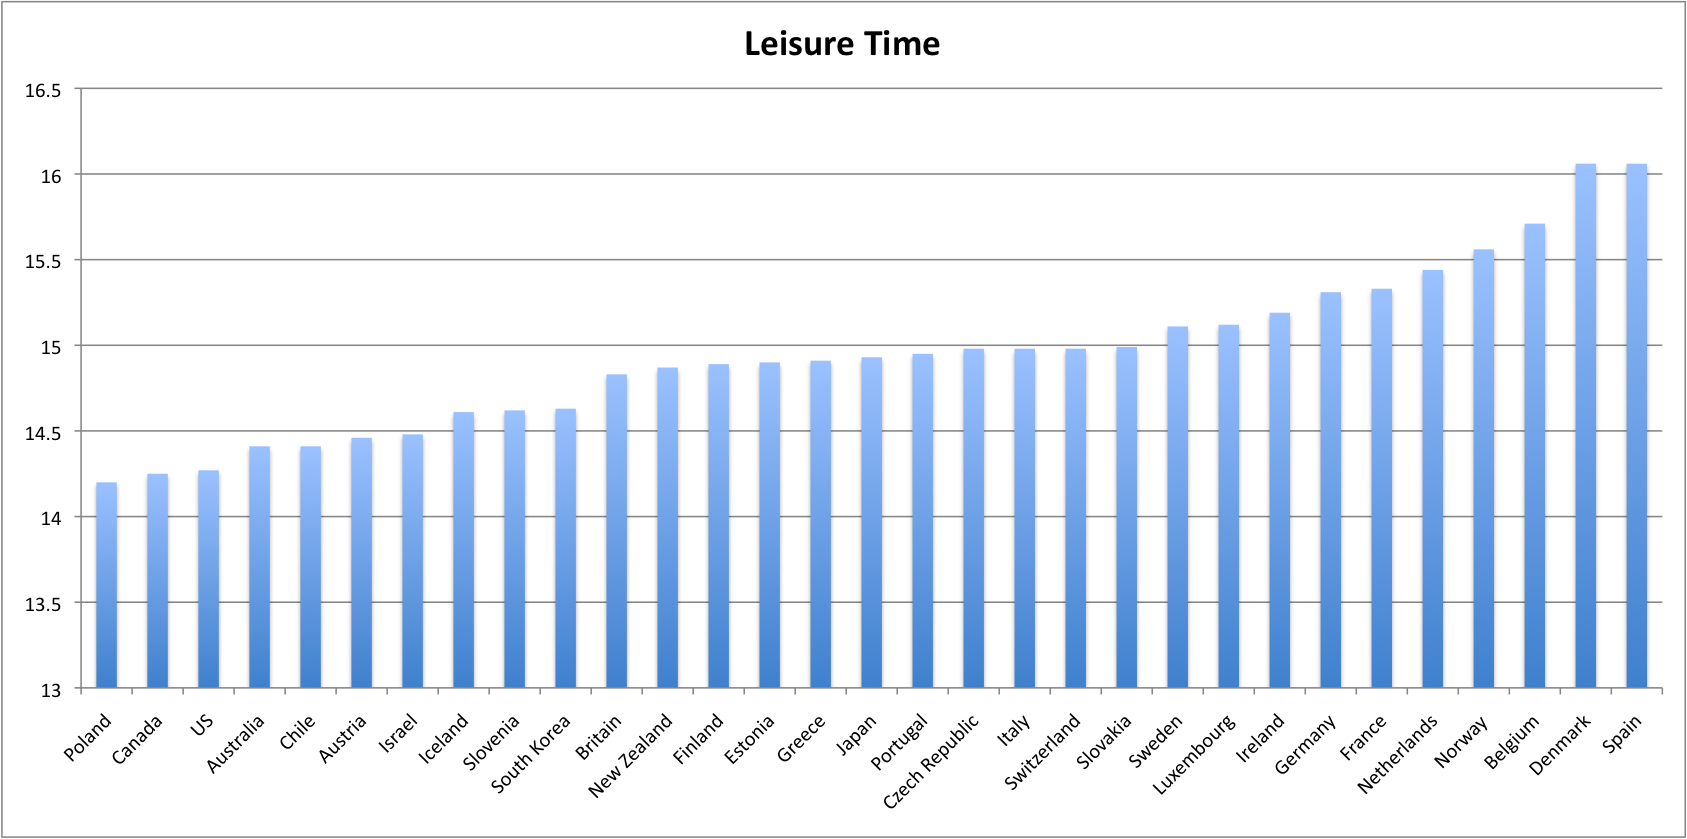
- Leisure Time (This indicator measures the amount of minutes (or hours) per day that, on average, full-time employed people spend on leisure and on personal care activities.)
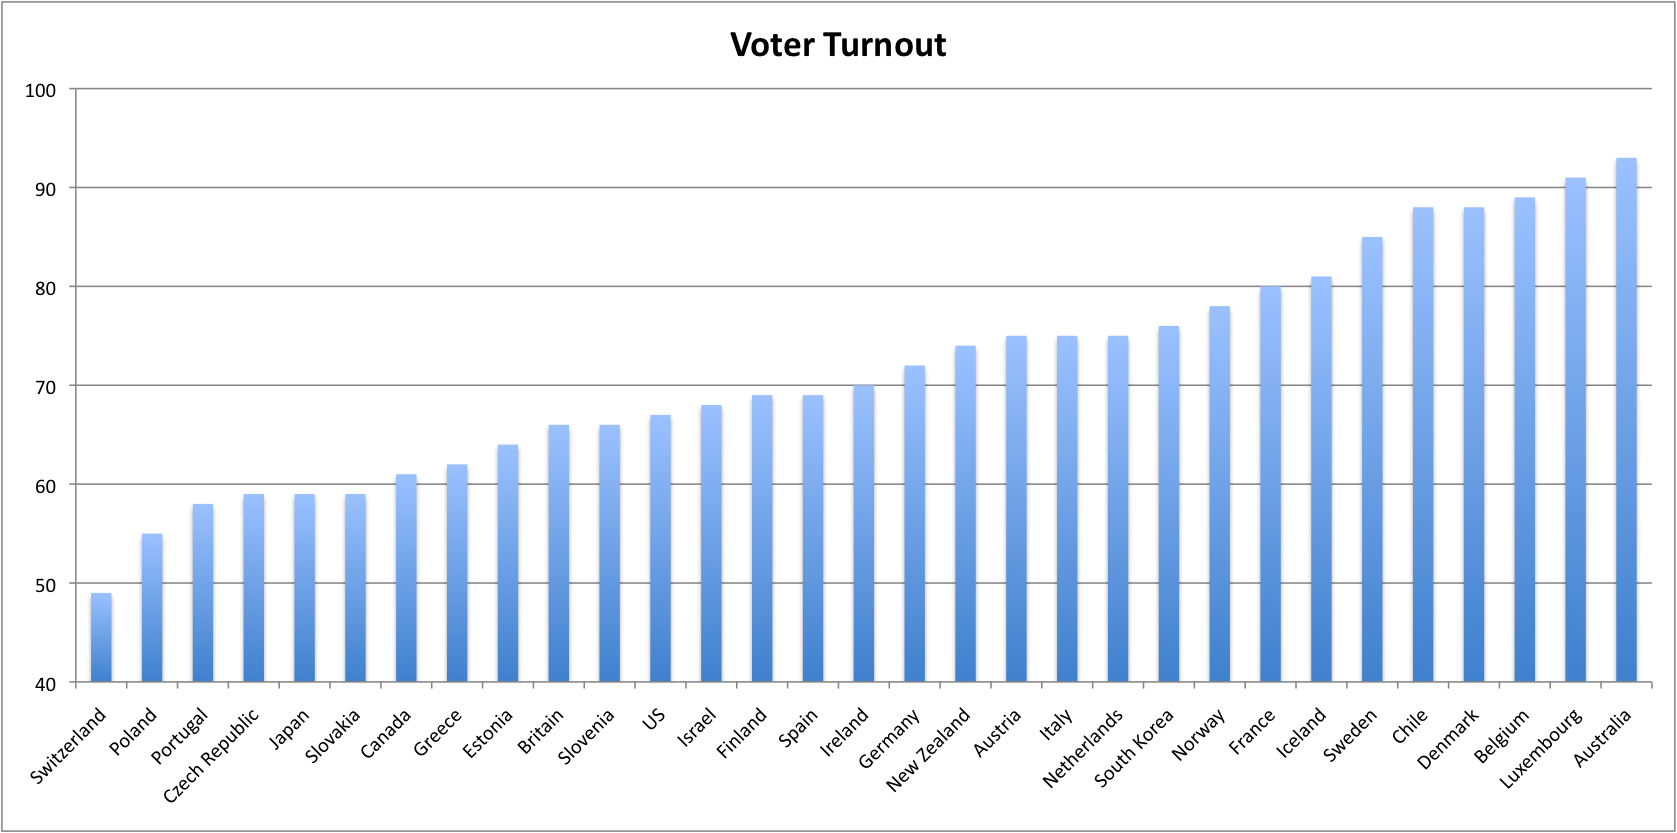
- Voter Turnout (Voter turnout is here defined as the ratio between the number of individuals that cast a ballot during an election (whether this vote is valid or not) to the population registered to vote.) Note here that Australia has the highest voter turnout, which is to be expected since it’s mandatory to vote there.
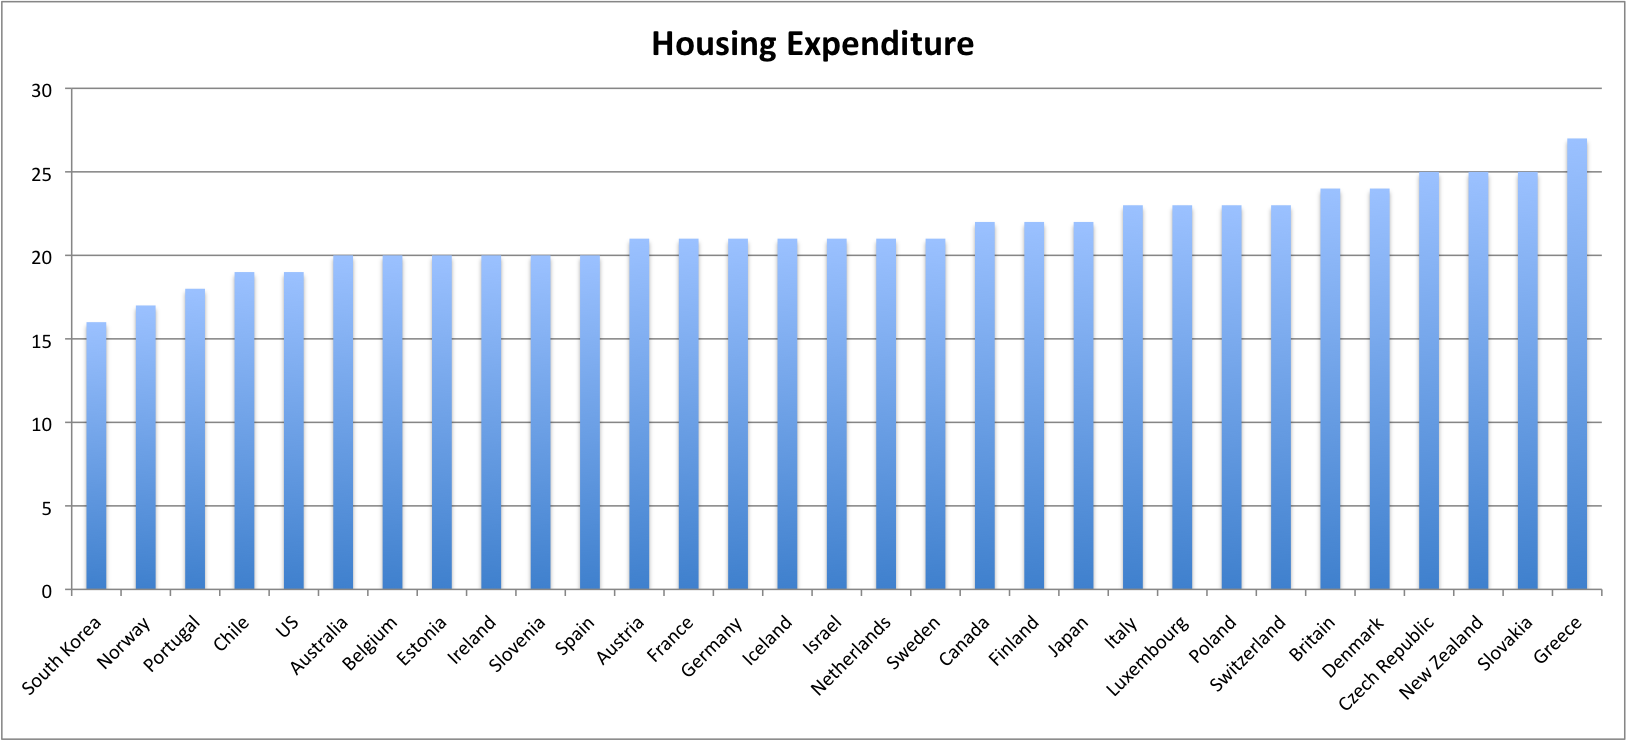
- Housing Expenditure (This indicator considers the expenditure of households in housing and maintenance of the house, as defined in the SNA (P31CP040: Housing, water, electricity, gas and other fuels; P31CP050: Furnishings, households’ equipment and routine maintenance of the house)).
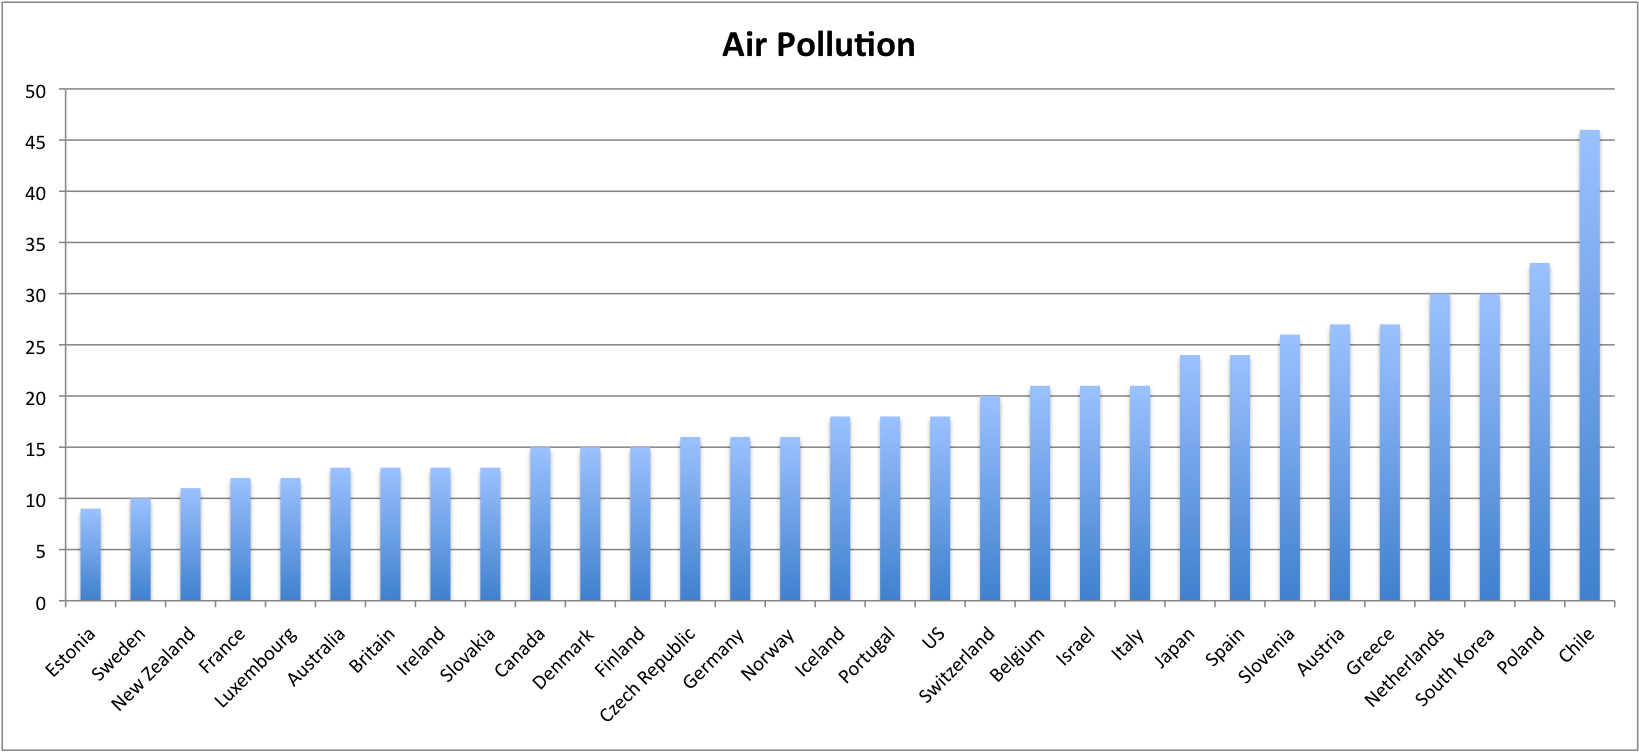
- Air Pollution (The indicator is urban-population weighted average of annual concentrations of particulate matters less than 10 microns in diameter (PM10) in the air in residential areas of cities with more than 100,000 residents.)
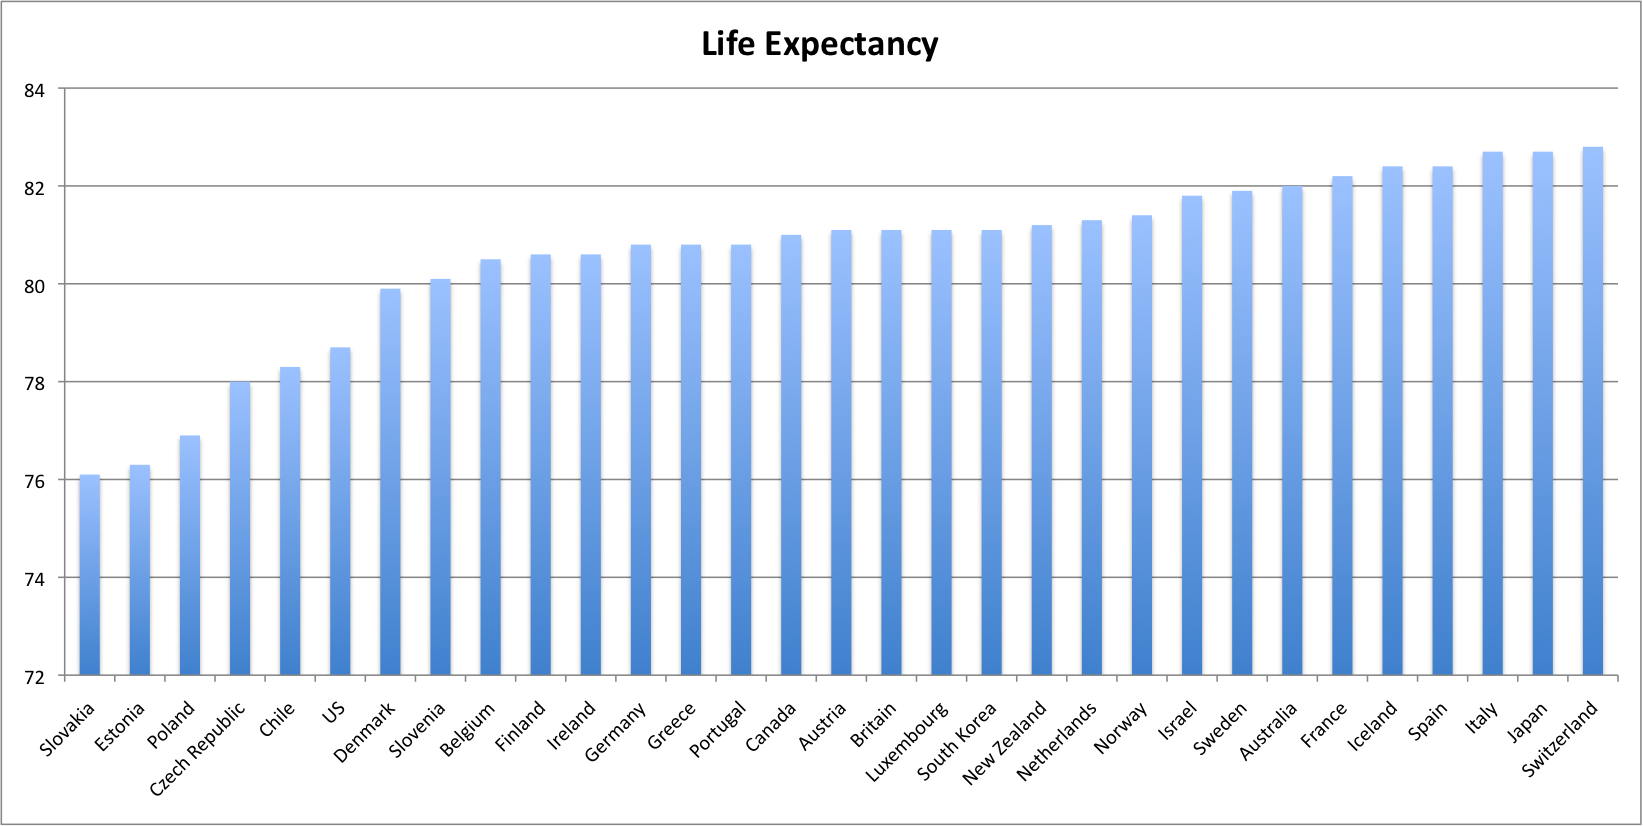
- Life Expectancy (Life expectancy measures how long on average people could expect to live based on the age-specific death rates currently prevailing.)
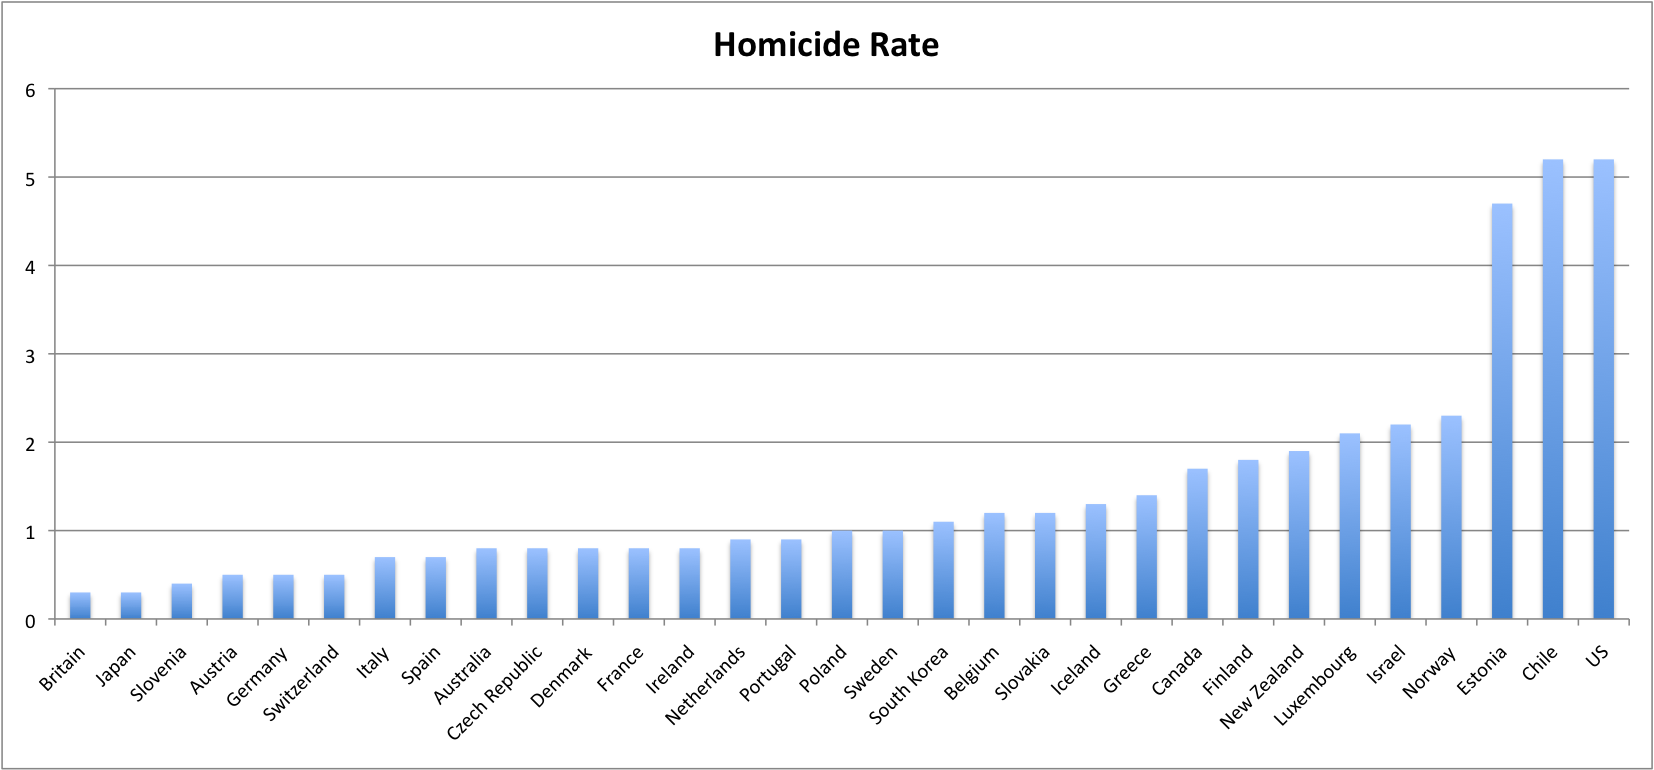
- Homicide rate per 100,000 people
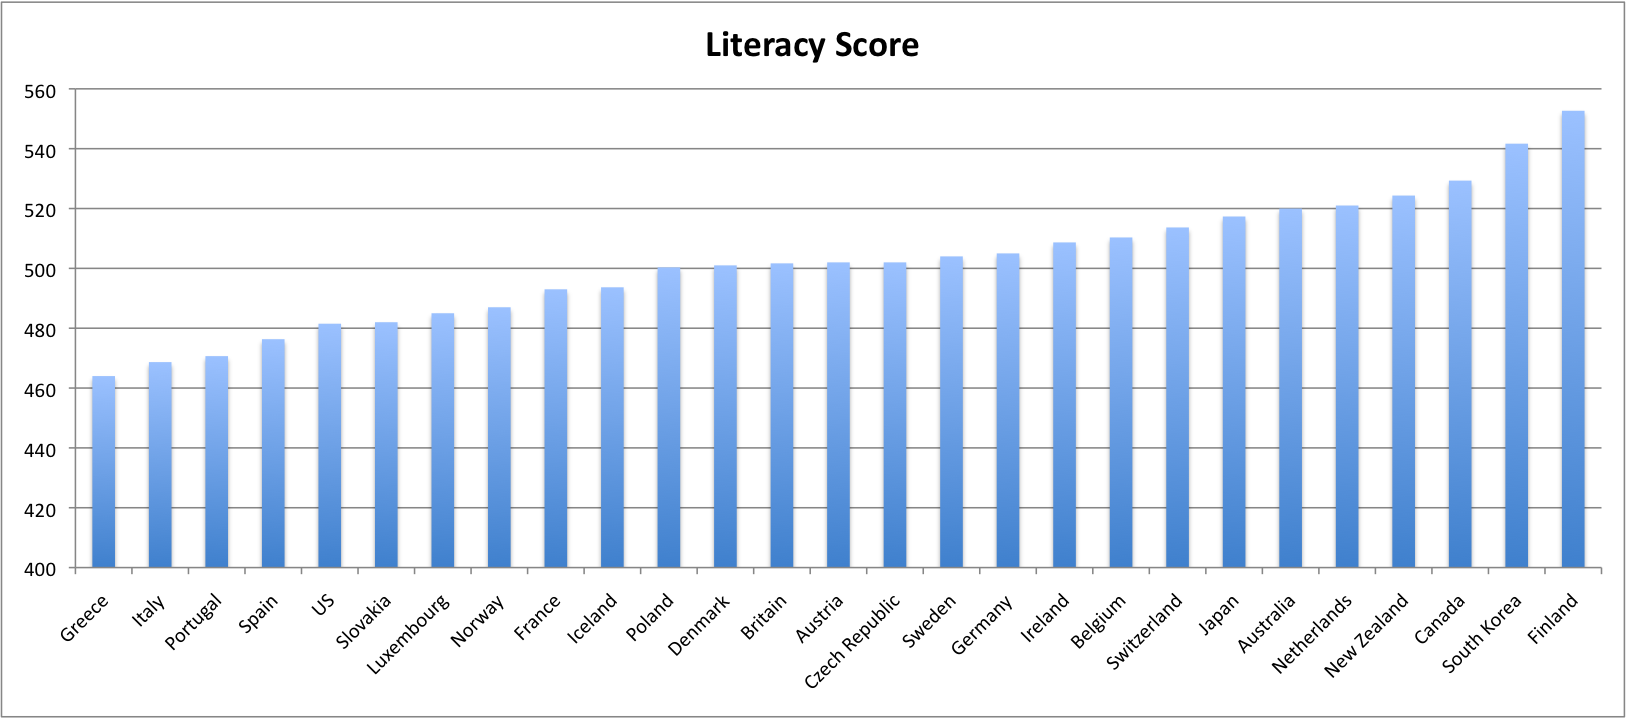
- Literacy rate (Mean literacy performance is the average of mathematics, reading and science literacy scores. Data is for 15-year-old students.)
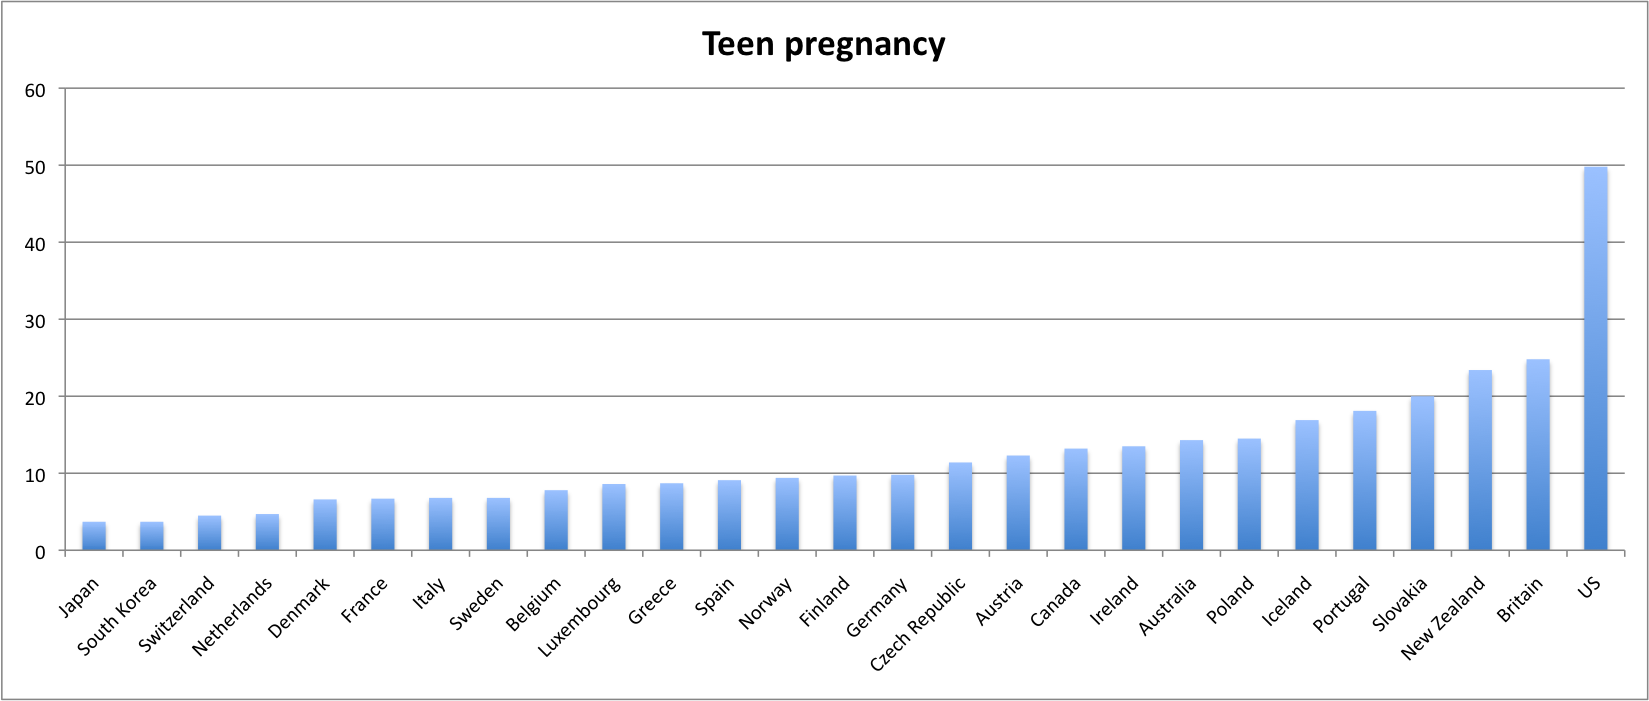
- Teenage Pregnancy (Teenage birth rates are measured as births per 1,000 15 to 19-year-old females for the year 2005.)
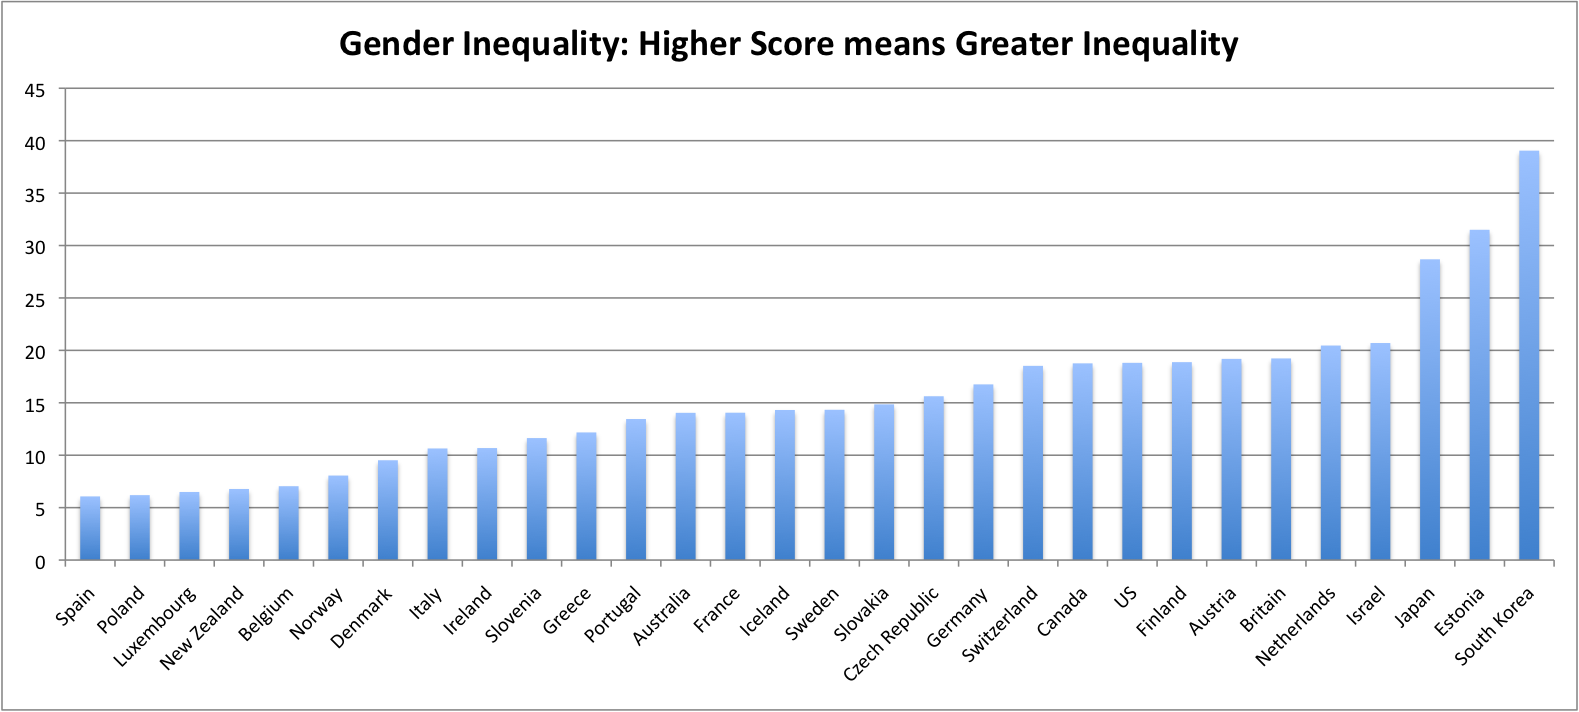
- Gender Inequality (The Gender, Institutions and Development Database (GID-DB) presents comparative data on discriminatory social institutions related to gender inequality. The database includes the 14 variables of the 2012 Social Institutions and Gender Index (SIGI) as well as the overall rankings and scores for the SIGI and its sub-indices.)
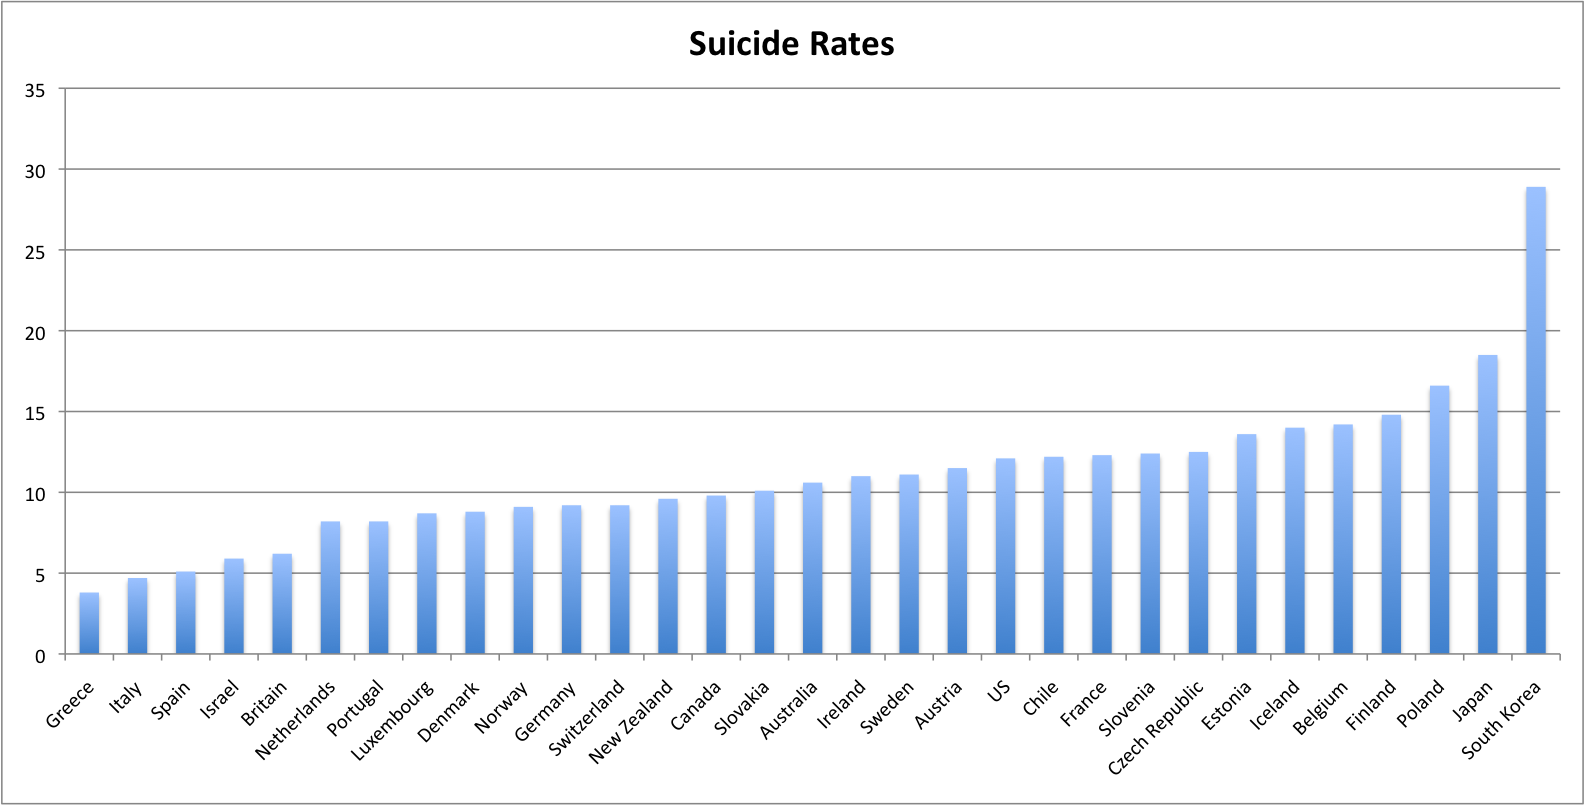
- Suicide Rates per 100,000, both sexes
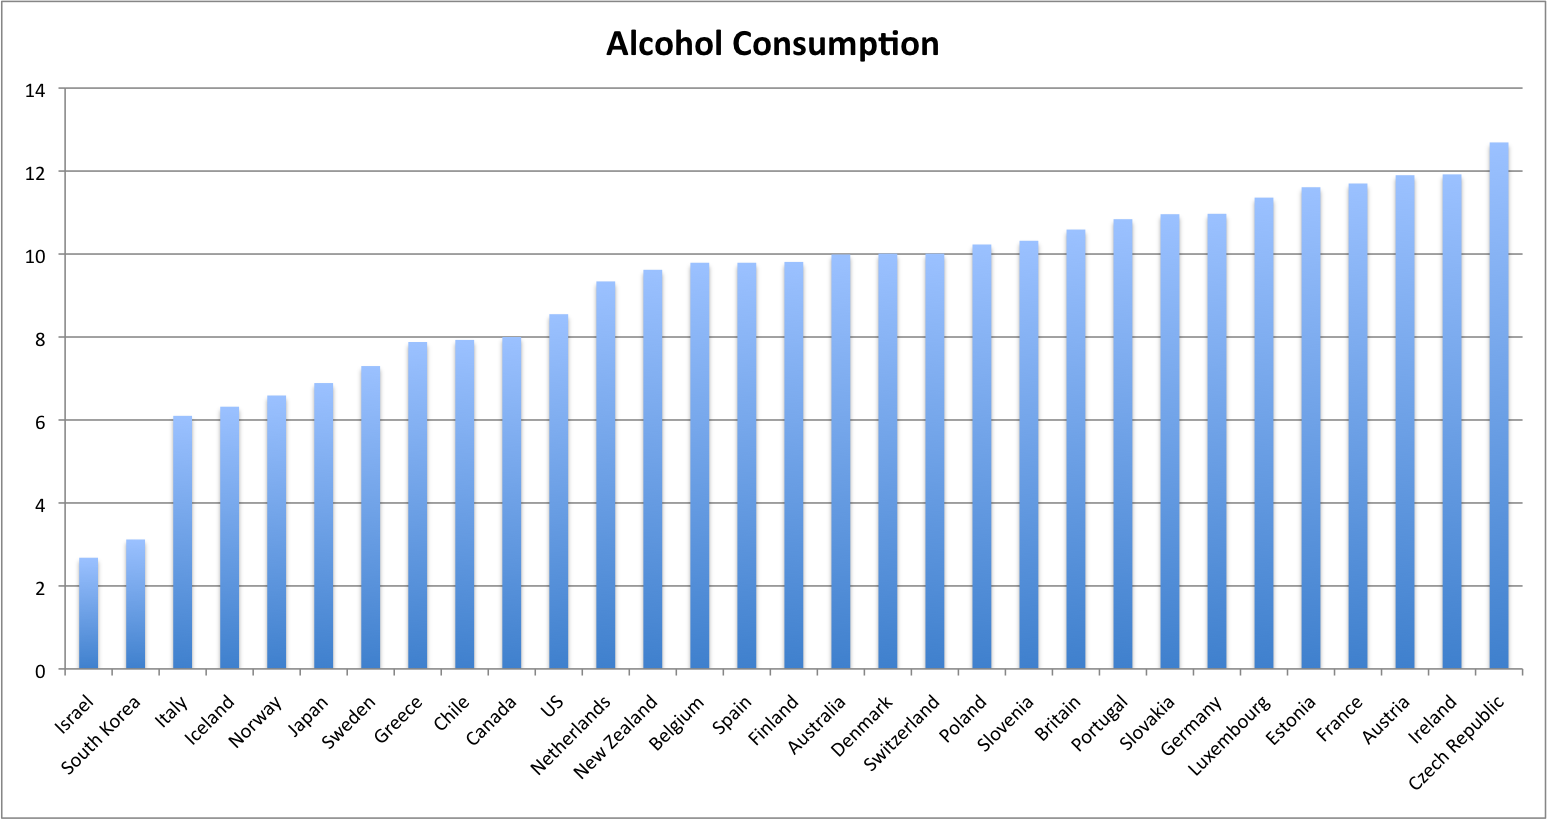
- Alcohol Consumption (all types of alcohol for aged 15+ per capita)
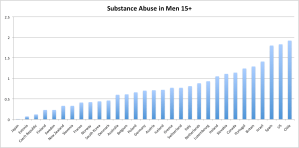
Substance Abuse (prevalence (%) of drug use in males aged 15+)
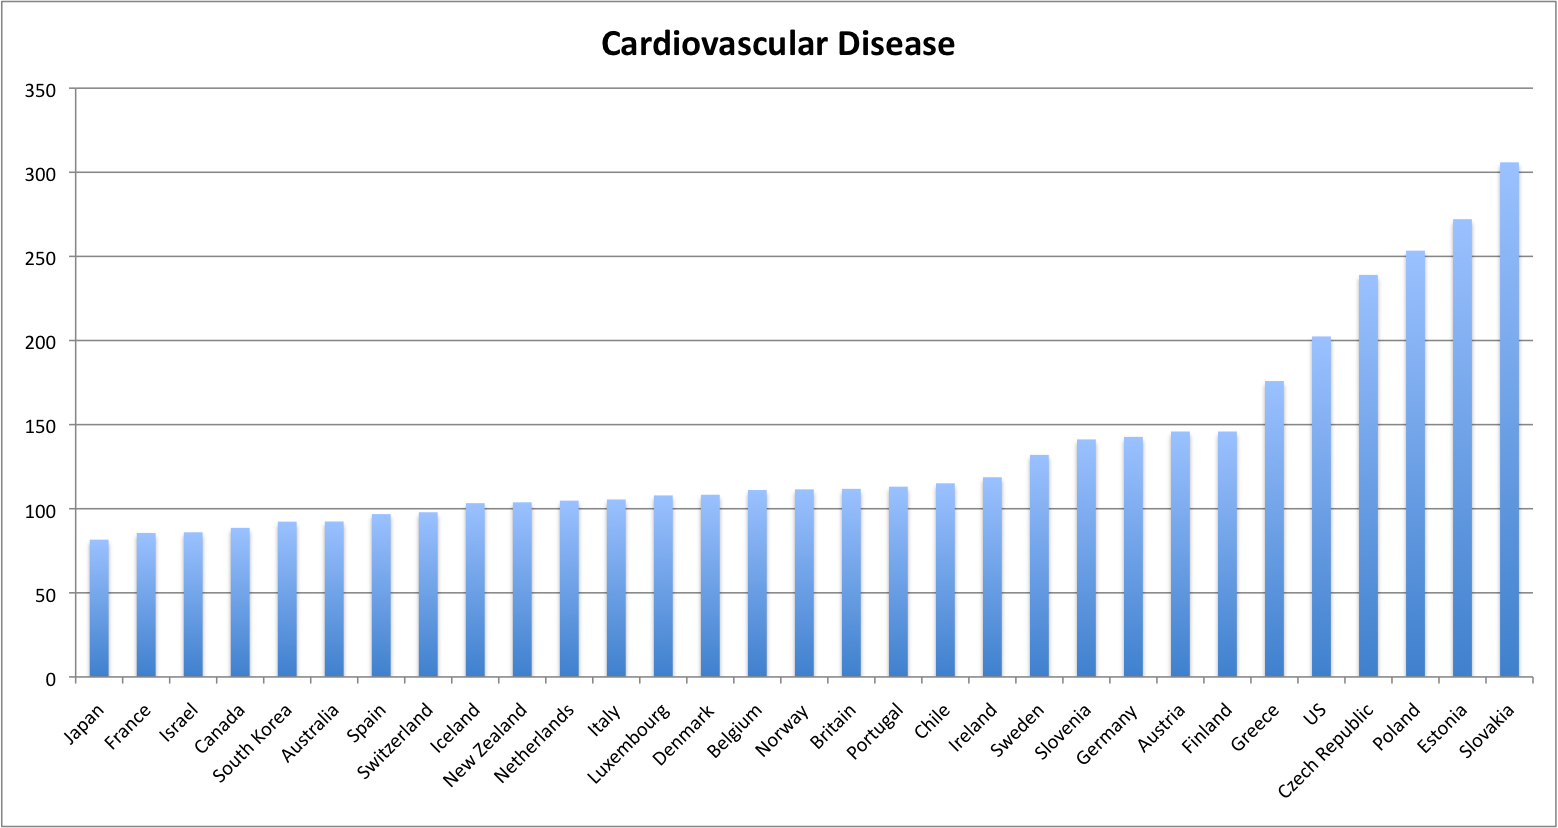
- Cardiovascular Disease per 100,000, both sexes
Then I cross-referenced each one of these metrics with every single other one, looking for evidence of correlation. I calculated the degree of correlation here, which you’ll see below in parentheses.
Below are the most striking results related to wealth and inequality.
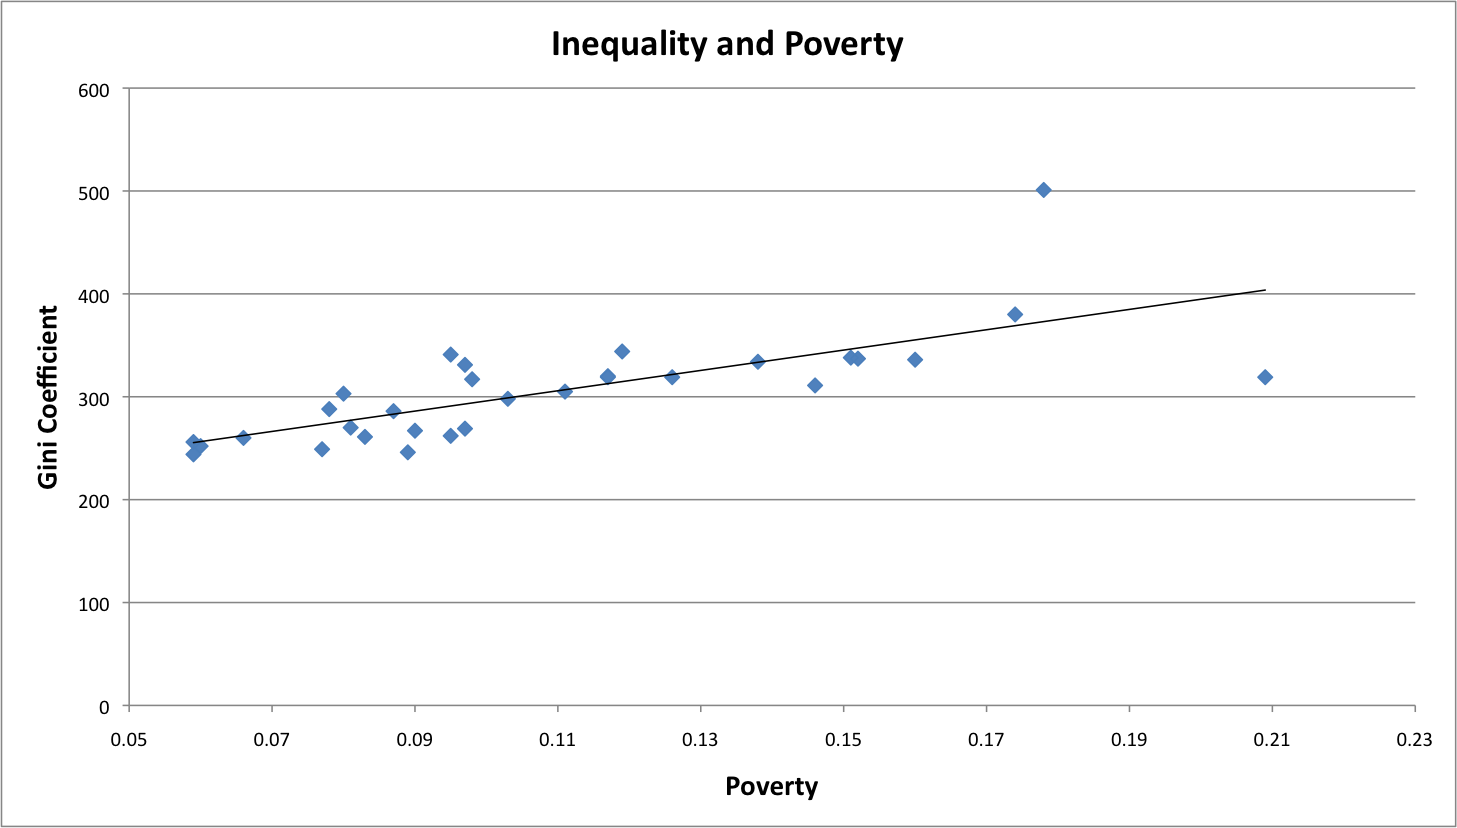
Poverty
The correlation between inequality and poverty is +.74. That is, where there’s greater inequality, there’s much more poverty.
One way to respond to the problem of poverty is to tax. When countries receive more revenue through taxation, there’s less poverty (-.5)
Some of the ill effects of poverty include much more spending on the military (+.67), while spending less on education (-.43). Countries with more poverty have less life satisfaction (-.35) and less leisure time (-.39); they have more air pollution (+.42), more homicides (+.41), and many more people addicted to illegal drugs (+.51).
Inequality
While poverty affects people’s wellbeing quite a bit, so does inequality. Remember, the inequality measure I’m using here is the Gini Coefficient, which measures how much more wealthy the top earners are than the bottom. Inequality—as separate from poverty—has a very negative effect on people.
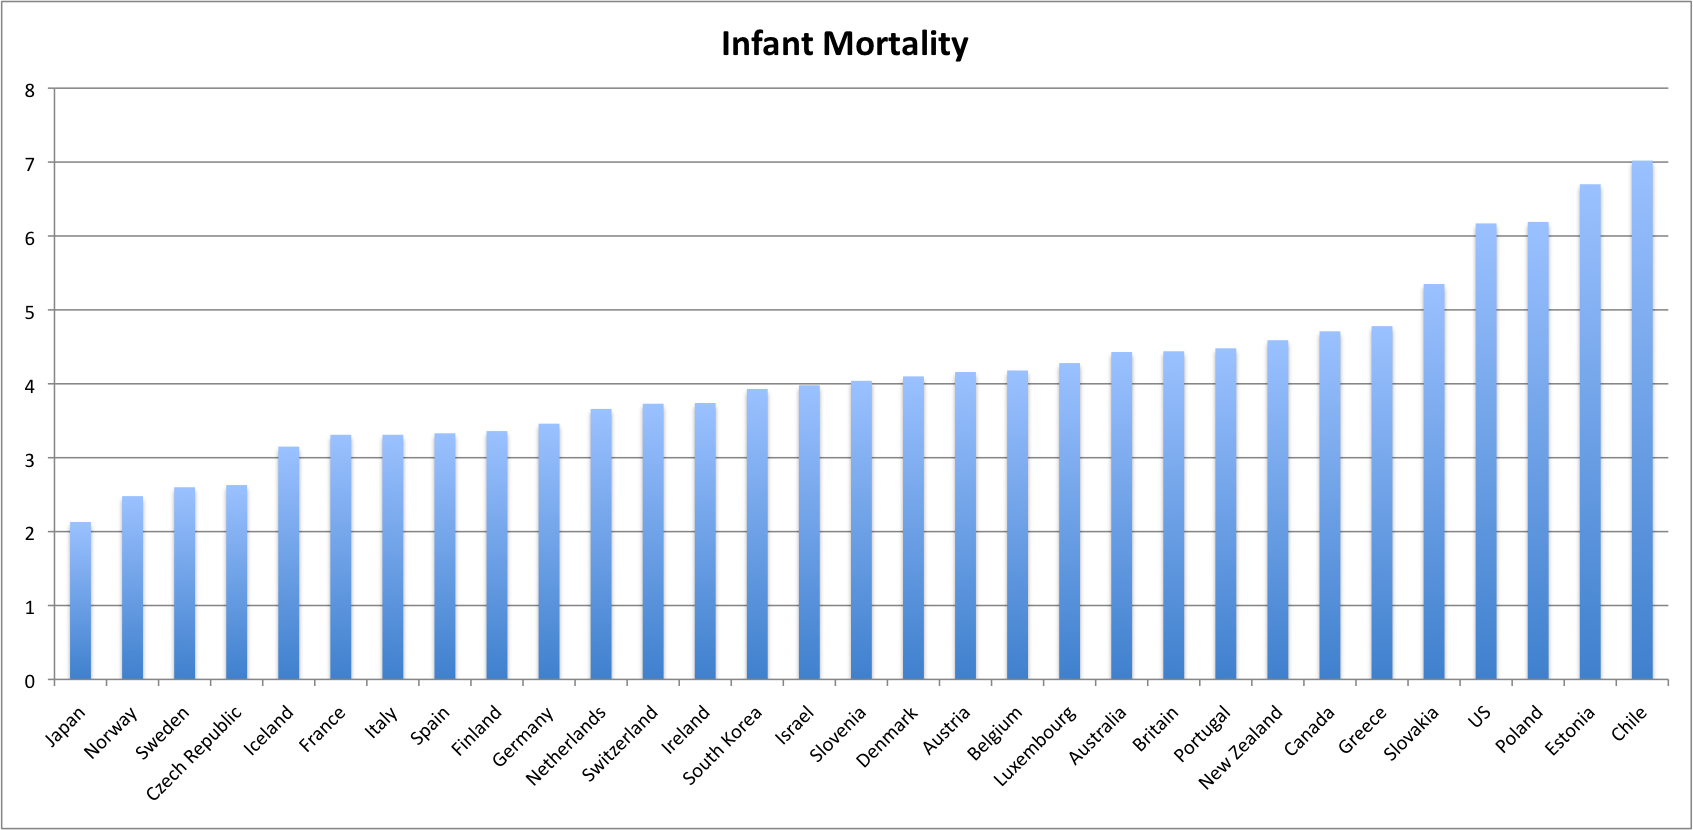
Unequal societies have a much higher infant mortality rate (+.55).
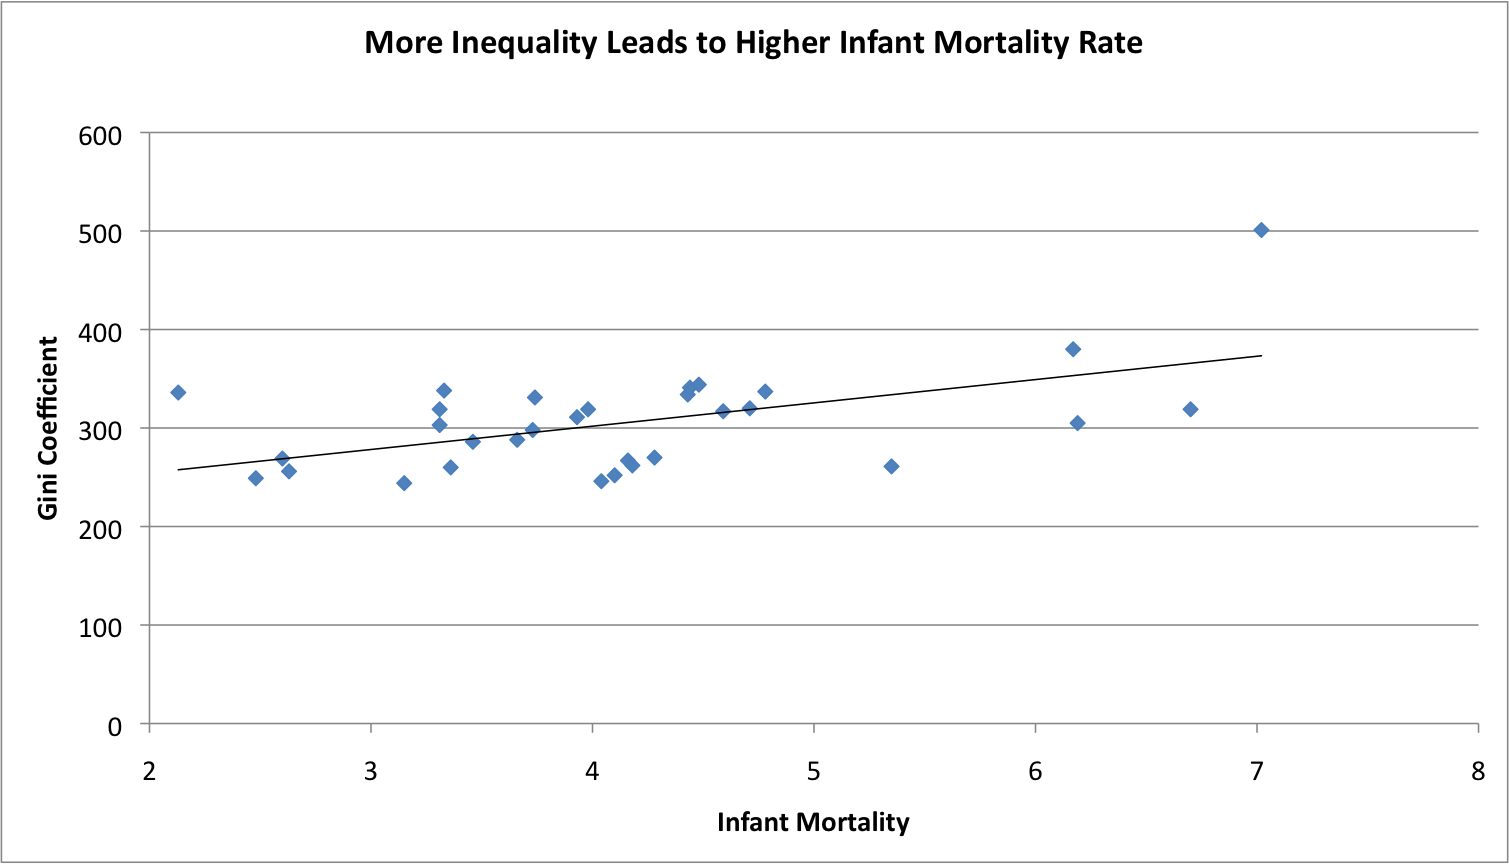
Inequality has more of an affect on infant mortality than poverty alone (for poverty, the correlation is only +35). And wealth does not counteract this inequality effect; countries with higher net financial wealth barely reduce the mortality rate (-.12).
Unequal societies also have a much larger prison population (.52).
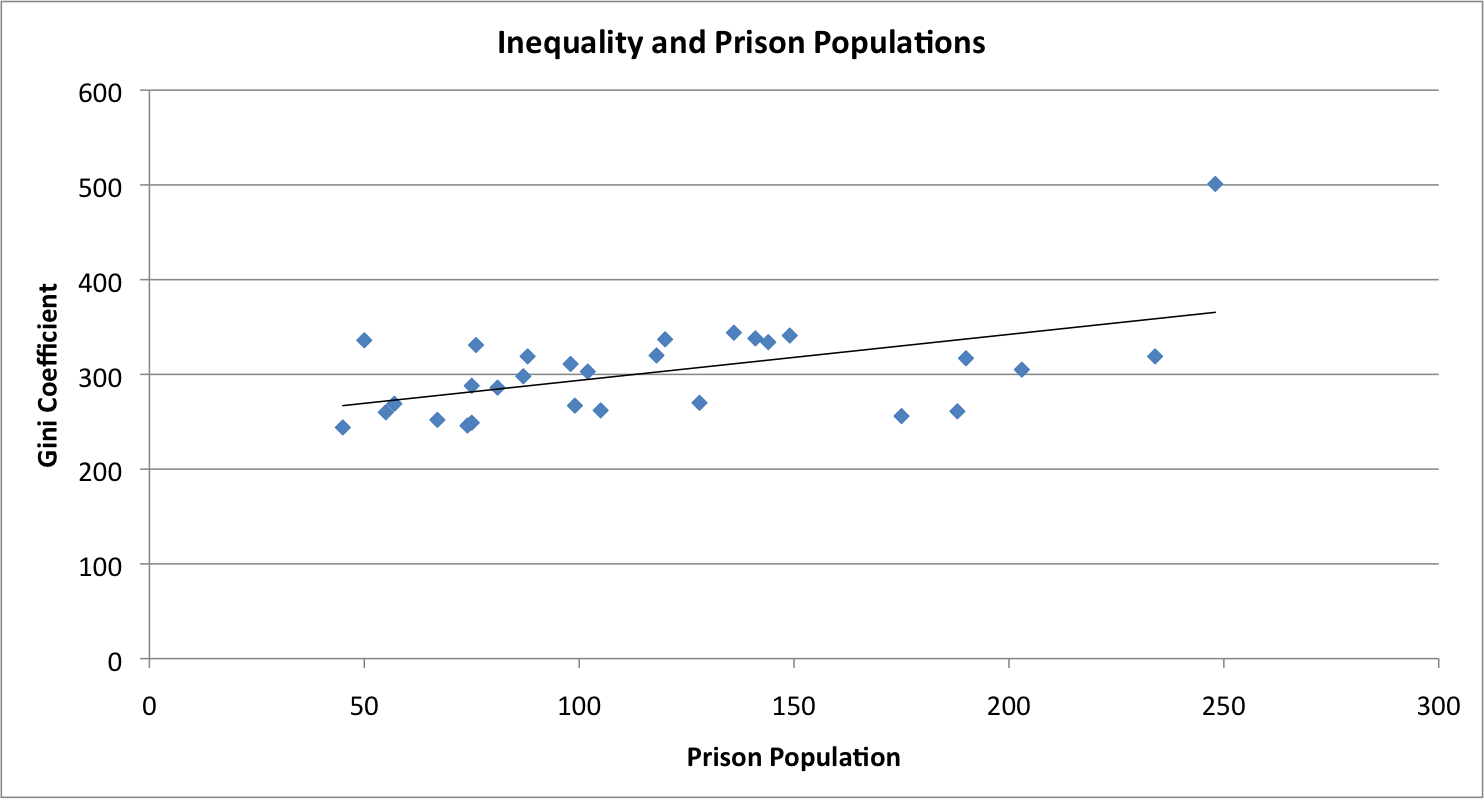
Inequality also lowers a country’s GDP per capita (-.28), and the lower the GDP per capita is, the more people there are in prison (-.59), creating a sort of domino effect.
Not only does inequality increase prison populations, it also directly correlates with homicide rates (+.53).
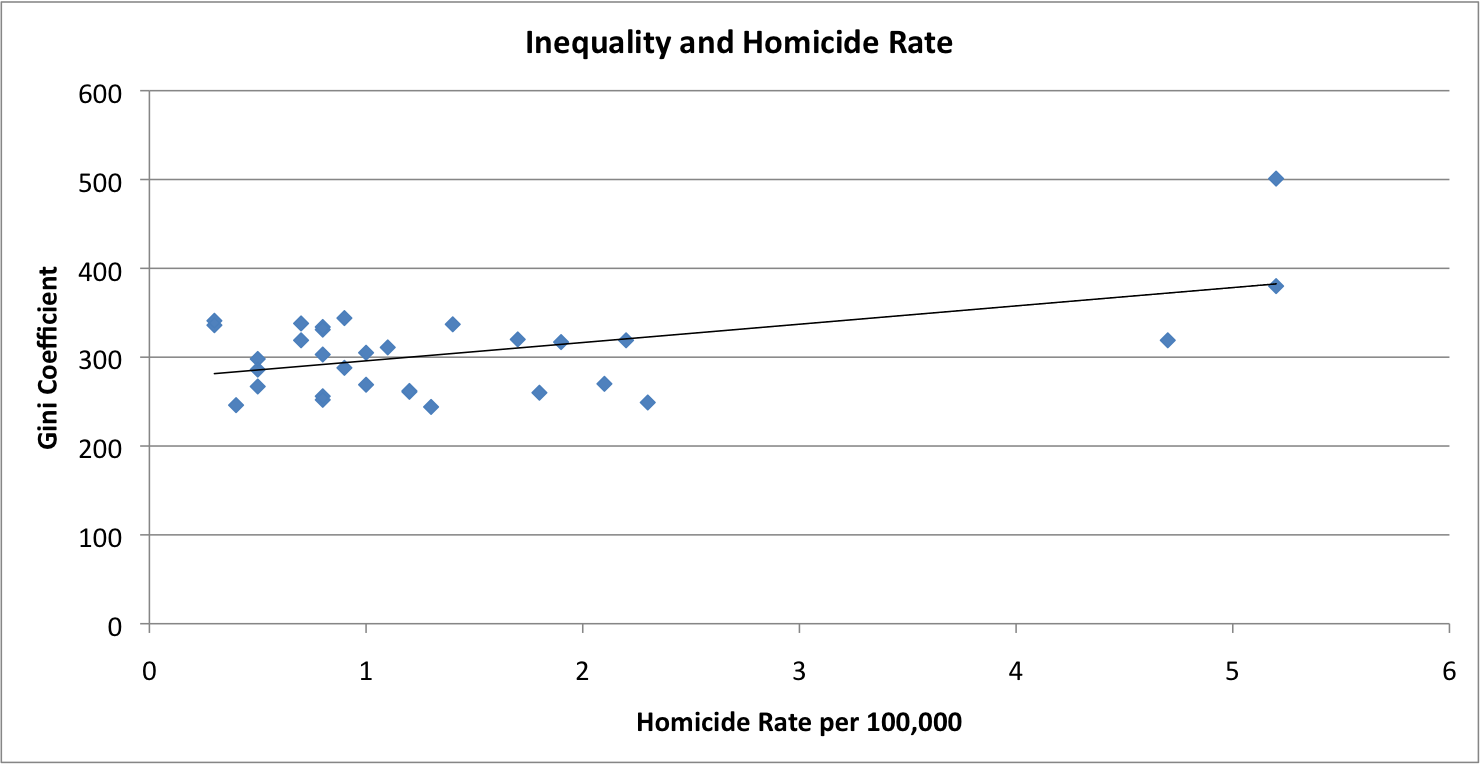
The more unequal a society it, the greater a chance you will be murdered. There is almost zero correlation between GDP per capita and homicide rates (-.01).
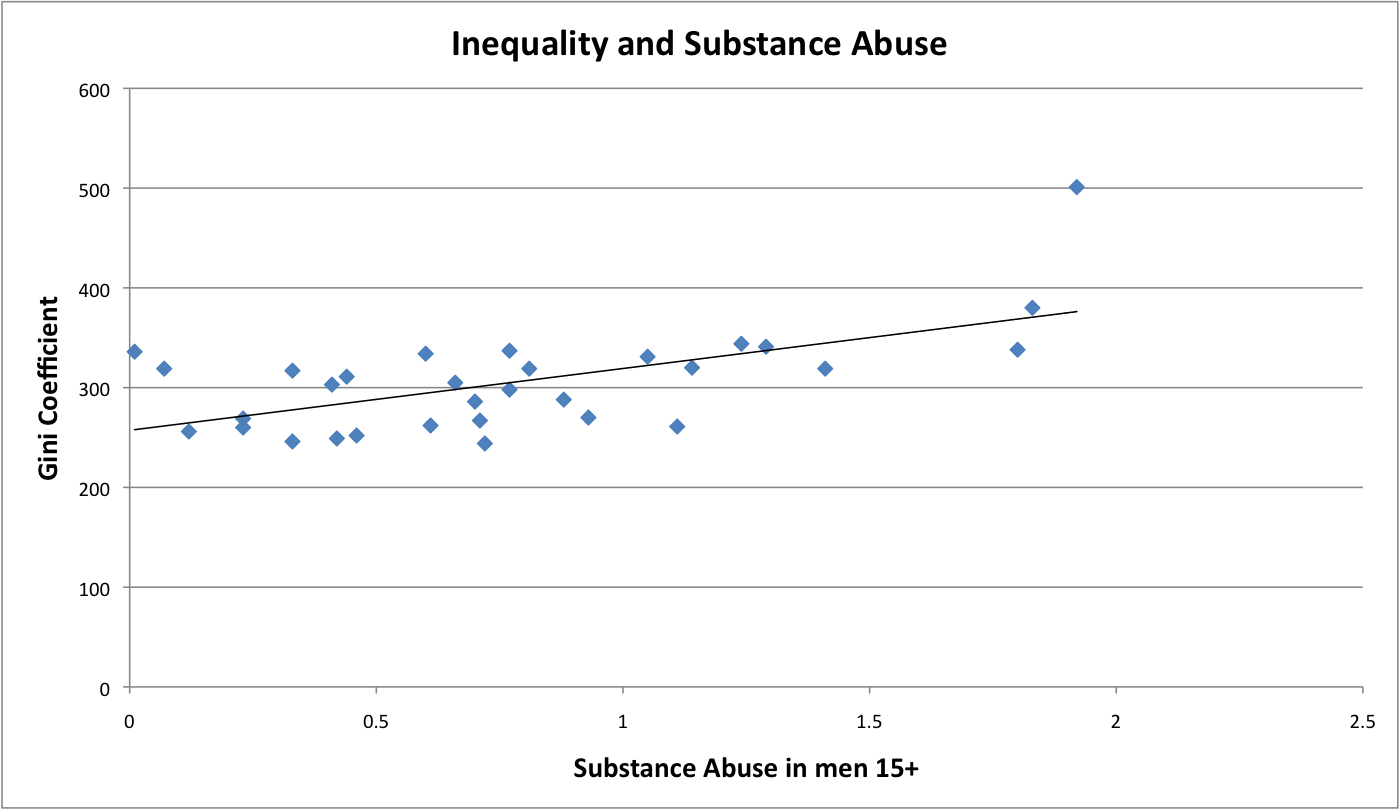
In addition to higher infant mortality rates, larger prison populations, and increased homicide rates, there is a greater prevalence of substance abuse in more unequal societies (.62).
Some less statistically significant effects of income inequality include more spending on the military (.36), while spending less on education (-.32). There’s lower life satisfaction (-.28), less leisure time (-.34), and more air pollution (+.46).
All in all, inequality sucks for us.
Wealth
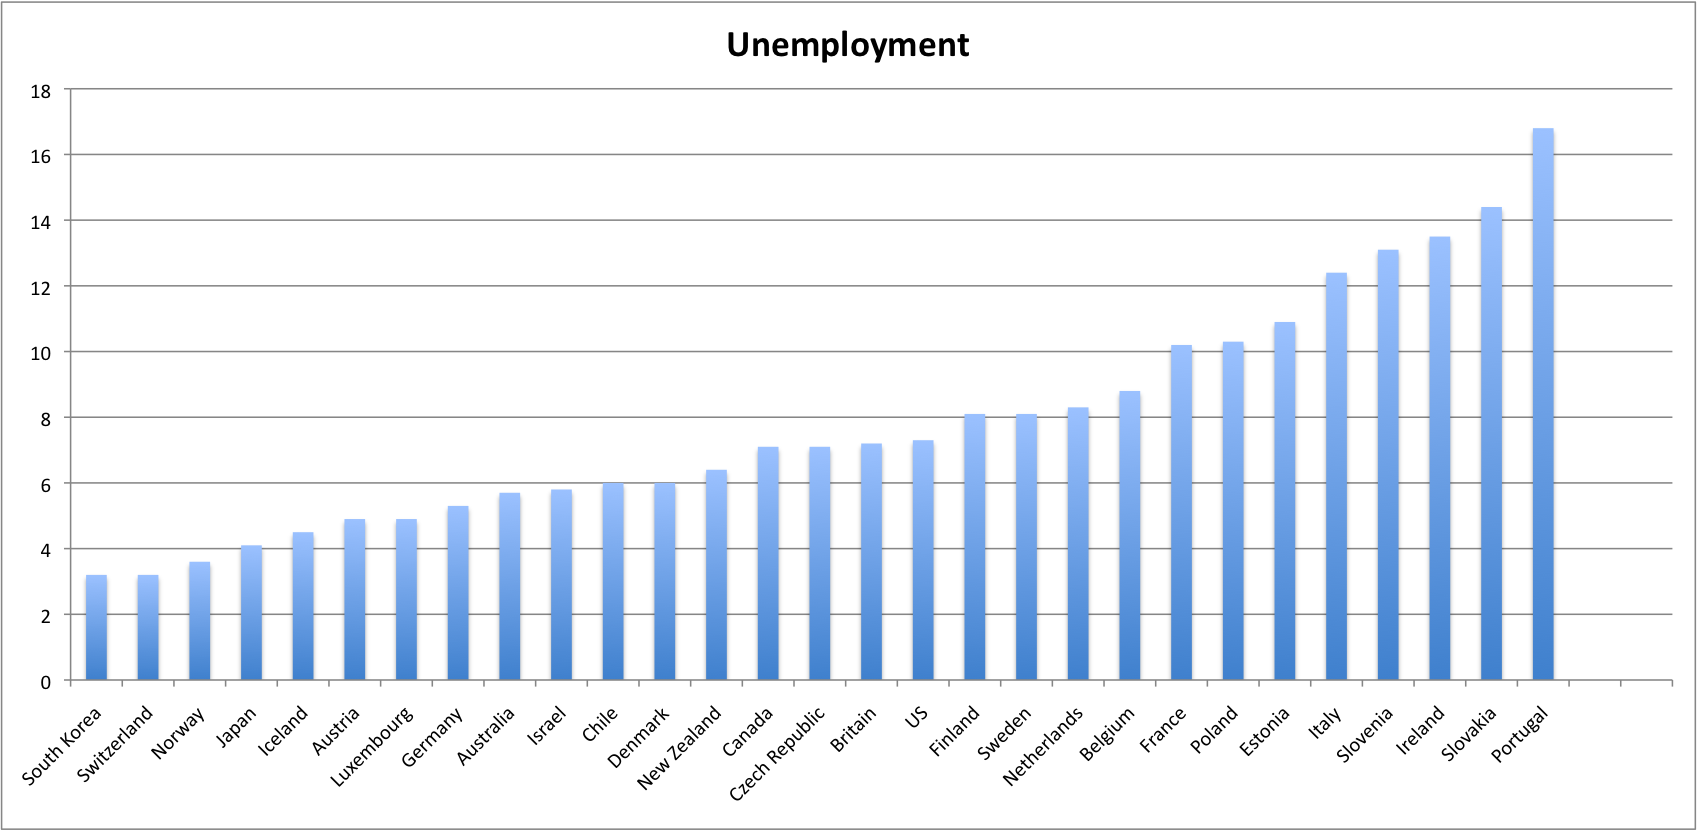
There are some benefits of wealth, however. Countries with higher GDP per capita spend more on healthcare (+.35) while spending less on the military (-.41). And people living in countries with greater wealth report much higher levels of life satisfaction (+.65)—maybe money can buy happiness. The rate of unemployment is also lower with higher GDP per capita (-.51).
Redistribution
Economically, redistribution of wealth has a big negative effect on GDP real growth (-.56). That is, when a country moves money from the rich to the poor, there’s in fact less economic growth and greater unemployment (+.44). But, redistribution dramatically reduces inequality (-.52) and lowers poverty (-.44), mostly through higher taxation (+.55).
A benefit of redistribution is that it reduces air pollution (-.48). We may have less growth, but we also have cleaner air, greater equality, and less poverty. And there would be less gender inequality (-.49).
I’ve summarized the major results below:
Benefits of wealth:
Higher life satisfaction (+.65)
Lower unemployment (-.51)
Lower prison populations (-.59)
More spending on healthcare (+.51)
Harms of poverty:
Greater military spending (+.67)
Higher instance of substance abuse (+.51)
Greater inequality (+.74)
Less revenue through taxation (-.5)
Harms of inequality:
Higher infant mortality rate (+.55)
Larger prison population (+.52)
Higher homicide rates (+53)
Higher instance of substance abuse (+.62)
There are no statistically significant benefits of inequality.
One of the ways to reduce inequality is to tax. There are benefits of higher taxes too:
Lower infant mortality (-.57)
More spending on education (+.51)
Smaller prison population (-.61)
More leisure time (+.57)
Less inequality (-.56)
Less poverty (-.5)
There is no statistically significant harm done by greater taxation.
So, we get the following conclusion: inequality does significant harm to an individual’s life, liberty, and mental health, and it does not benefit anyone. Taxation, which partly aims to limit inequalities, does significant good for an individual’s life, liberty, and education. The unequivocal benefits of wealth are greater life satisfaction and lower unemployment (which probably causes the greater wealth and not the other way around). But we must balance these benefits against the great social harms of poverty and inequality, as well as the benefits of higher taxation.
In the end, I conclude that inequality does more harm than good. When wealth is achieved on the back of poverty, low taxation, and inequality, its benefits are immoral. The fiscal conservative focuses solely on the top—he is concerned primarily about avoiding taxes for the rich. We cannot be solely concerned about the rich and the poor at the same time. Being concerned primarily about the rich leads to vast inequalities, which causes more harm than good. Causing more harm than good makes a policy morally wrong. And so, the fiscal conservative stance is morally wrong.
The fiscal liberal is an advocate for higher taxation and expanded social welfare programs, and so the liberal’s position is in line with these results. She is advocating for a safety net for the disenfranchised. She believes we ought to balance the budget by raising taxes on the super rich. And by helping the poor and taxing the rich, only the fiscal liberal can reduce inequality. If reducing poverty and inequality reduces harms to individuals, then it is the ethically superior approach. We ought to be fiscal liberals.
Next time I am going to shift from the argument that fiscal conservativism does more harm than good to the “Golden Rule” argument against fiscal conservatives. What if I were in that position? How would I want to be treated? If I were fully rational, and I didn’t know whether I was rich or poor, smart or dumb, strong or weak, what sort of system would I want? Would I want less spending and lower taxes, or would I want more spending with higher taxes?
Following John Rawls, we might come to the conclusion that the ideally rational person would be okay with some inequalities so long as those inequalities are to everyone’s advantage. And the rational person would certainly want to make sure he was taken care of if he was poor, dumb, and weak.
Following the American Dream doctrine, however, the ideally rational person might come to the conclusion that we can all make it to the top someday, and so we shouldn’t stab our future selves in the foot with a high tax burden. And these would be moral conclusions about what we ought to do; they are considerations of justice.
I’ll argue we should follow Rawls. Stay tuned!
Appendix:
Here are some other interesting correlations I discovered:
- Countries that seem less corrupt spend more money on education (+.63).
- Countries that seem less corrupt have greater life satisfaction (+.77).
- Countries that seem less corrupt have higher literacy scores (+.52).
- When more people are in prison, there’s a much higher infant mortality rate (+.73).
- When there’s a higher infant mortality rate, the life expectancy is lower (-.69).
- Higher infant mortality rates correlate with greater homicide rates (+.67).
- Higher infant mortality rates correlate with more teenage births (+.49).
- There’s more growth where there’s less unemployment (-.58).
- When there’s more growth, there are higher literacy scores (+.52).
- With greater spending on education comes higher life satisfaction (+.53).
- When you spend less on healthcare, you get a higher prison population (-.56).
- Spending more on healthcare raises life expectancy (+.51).
- Where there’s higher unemployment, there’s lower life satisfaction (-.63).
- More people in prison correlates with a lower life expectancy (-.59).
- More people in prison correlates with a higher homicide rate (+.71).
- More people in prison correlates with a higher teen pregnancy rate (+.59).
- Life expectancy is much lower when there’s more cardiovascular disease (-.88).
- With higher literacy rates, both the suicide rate (+.59) and the degree of gender inequality (+.5) are higher.
- Where there is greater gender inequality, there is a higher suicide rate (+.56).
- The suicide rate is higher when there is less substance abuse (-.45).
