
In Part 1 of the series on income inequality, I argued that being a “fiscal conservative” is a moral stance. One of the principles of fiscal conservativism says that we ought to balance the budget by cutting spending rather than raising taxes. In fact, a fiscal conservative will hardly ever encourage raising taxes.
The main reason a conservative doesn’t want to raise taxes is because she is opposed to redistributing wealth. We ought not take money from the rich, and just hand it over to the poor.
Fiscal conservatives oppose redistribution because the government’s power to tax one group to give to another will lead to corruption. The government may pad its own pockets; it may instead give more money to the elite; it may let loads of money slip through the cracks. We would inevitably shift to an oppressive communist country, and communists are always corrupt.
“The main reason a conservative doesn’t want to raise taxes is because she is opposed to redistributing wealth.”
I tested this hypothesis that redistribution inevitably leads to corruption. According to Transparency International here’s the ranking of perception of corruption in OECD countries:

As you can see, New Zealand has the highest score; that means the people of New Zealand perceive their government as very responsible. On the other end of the spectrum, Greece has very little trust in its government. The U.S. is in the middle.
Now I want to see the connection between corruption and redistribution. I’ll be relying again on the Gini Coefficient gathered by Pew. The Gini Coefficient is the degree of difference between the wealthiest and the poorest in a society; a high score means the society is quite unequal, and a low score means more equality.
Consider the Gini coefficient for inequality before any taxes are taken out:

Before taxes, Ireland is the most unequal country in the OECD. You should think of this as gross income. The U.S. ranks as the 10th most unequal country, again before any taxes are taken out.
But compare inequality before taxes to the following chart of inequality after taxes, which is like adjusted net income:
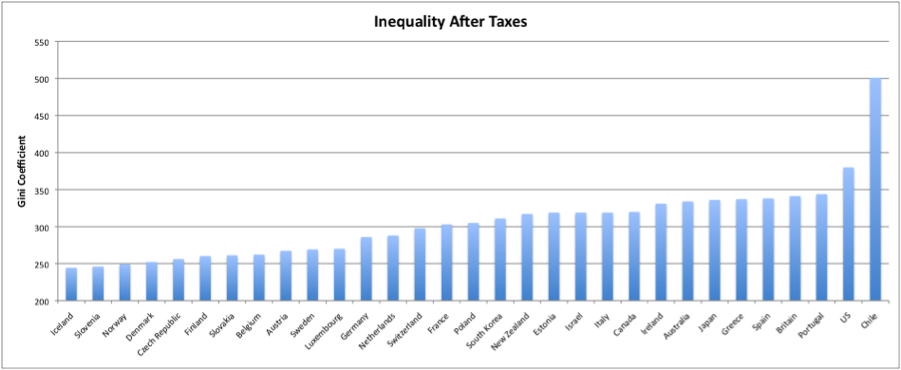
Ireland jumps down 8 places, and the U.S. jumps up to the second most unequal country. That suggests that Ireland redistributes more wealth than the U.S. Whatever inequalities in income there are before taxes for the Irish, things are evened out when it comes to actual take-home pay. The same cannot be said for the U.S.
I’m going to take this data from Pew and manipulate it a bit. I can subtract the “after taxes” measure from the “before taxes” measure to get some idea of how much wealth is redistributed through taxation.
Inequality before taxes – inequality after taxes = redistribution
That is, to bridge the inequality gap, some countries tax more. They tax the top to give to the bottom, which is evident in the difference between before and after tax levels of inequality.
Here’s a chart of which countries redistribute more money through taxation:
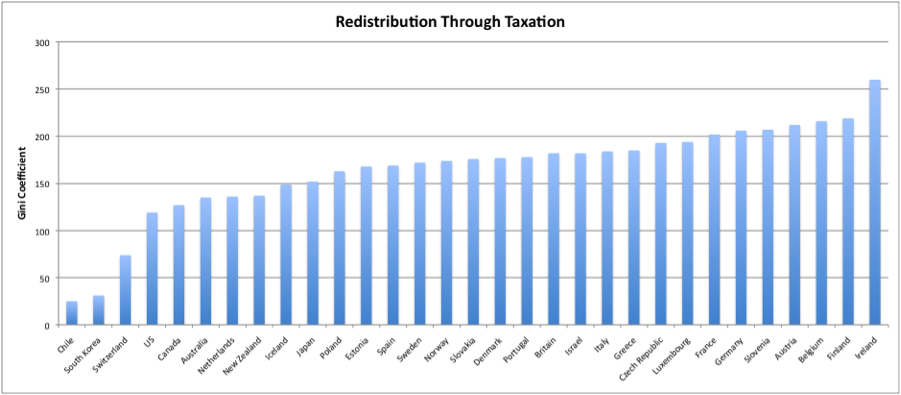
We shouldn’t be surprised that Ireland redistributes more wealth than the U.S. After all, the U.S.’s inequality rose when we subtracted after tax from before tax; Ireland’s position fell. And Chile had the highest after tax inequality (as well as the second highest before tax inequality), so it shouldn’t be a surprise that they redistribute hardly anything.
The fiscal conservative predicts that with more redistribution come higher levels of corruption in government.
But I found the exact opposite:
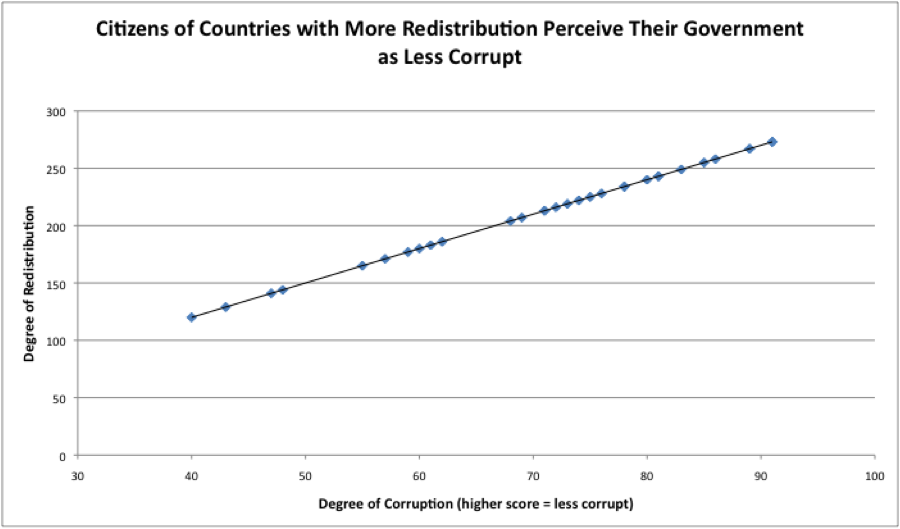
Incredible! There is a 1 to 1 correlation between more redistribution and less corruption. You can’t ask for a stronger correlation. This is the exact opposite of the fiscal conservative’s prediction.
Given this data, I might try to draw the conclusion that redistributing wealth—the fiscal liberal’s stance—reduces corruption. And since we don’t want corruption, then we ought to accept fiscal liberalism.
“There is a 1 to 1 correlation between more redistribution and less corruption.”
I think such an argument is too hasty. Again, correlation might not amount to causation (even though the closer the correlation is to 1, the more it suggests causation). But while correlation is not causation, it is still useful. The fiscal conservative expects there to be a correlation between greater redistribution and higher corruption; and seeing the exact opposite can go quite some way to proving them wrong.
It will take some time to completely undermine the fiscal conservative. This is simply a first step: redistribution of wealth does not lead to corruption. In fact, it looks like the opposite may be true. This by itself does not show the fiscal conservative position is unethical, rather it suggests that the fiscal liberal position is comparatively more ethical because it does not correlate with a corrupt government.
“Redistribution of wealth does not lead to corruption.”
Next time I will address some of the physical harms of inequality. With greater inequality come higher infant mortality rates, lower life expectancy, greater cardiovascular disease, and other health issues. This will bolster my argument that fiscal conservativism does more harm than good.
**Edit. It has come to my attention that there’s a possible objection to my methodology. Some have argued that my concept of redistribution here is inaccurate. I’d like to address this issue at the outset because I’ll be relying on this redistribution index in the future as well.
Here’s the objection: aren’t I just measuring the amount of wealth per person before and after taxes, with no concern for how those taxes are delegated? That is, most of our taxes go to things such as infrastructure, healthcare, education, military, etc, which benefit everyone. Only a smaller portion of taxes on the rich go directly in the pockets of the poor. My account of redistribution is not fine-grained enough to syphon out the redistributive parts from all the rest.
I think there is some truth to this objection. I have other charts that deal with taxation more precisely. For instance, here is a chart from the CIA Factbook. This chart shows taxes received by the national government, expressed as a percent of GDP:
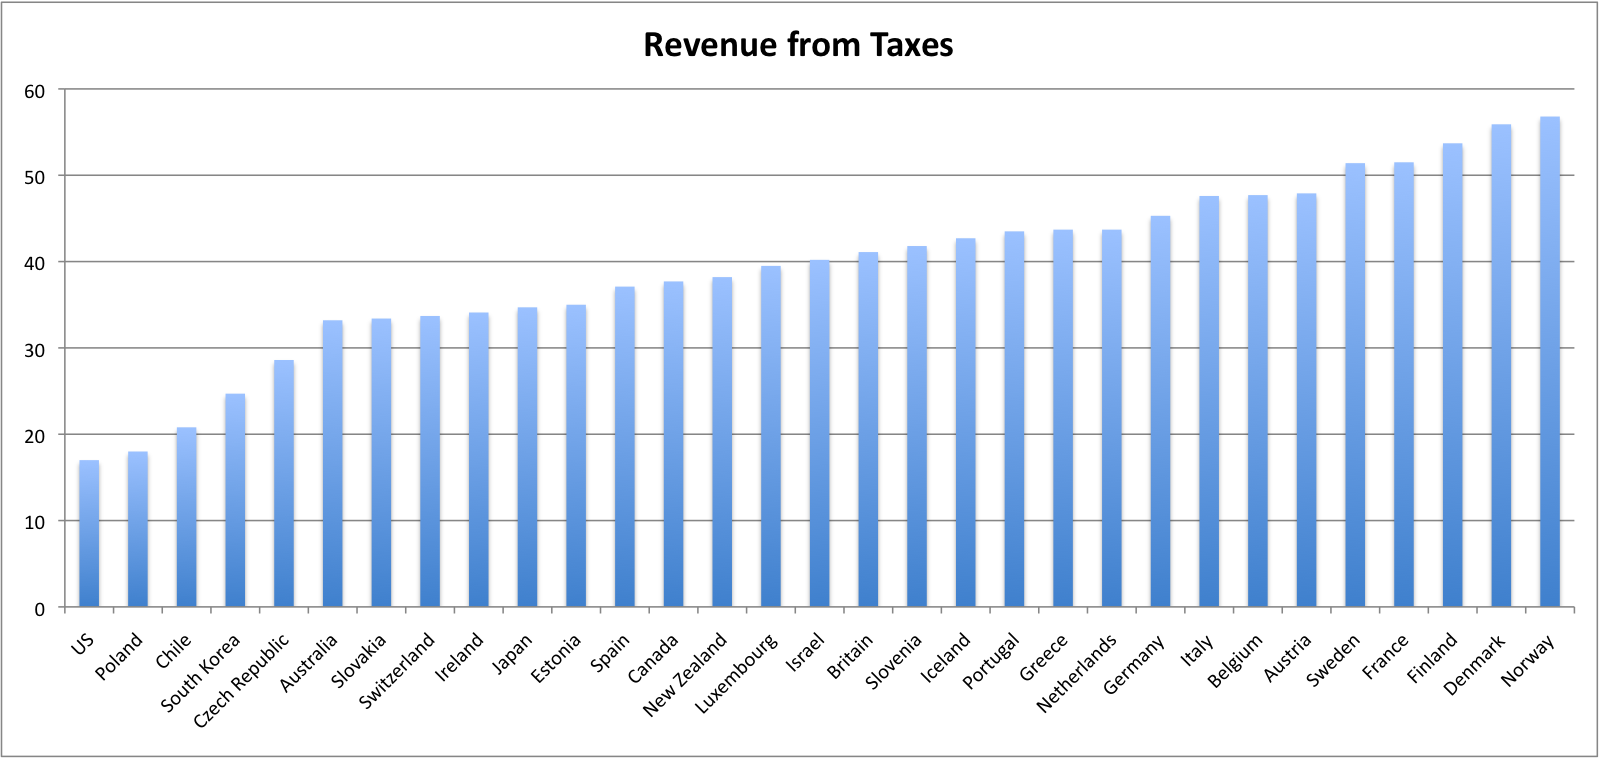
There is a .55 correlation between higher taxes generally and more redistribution:
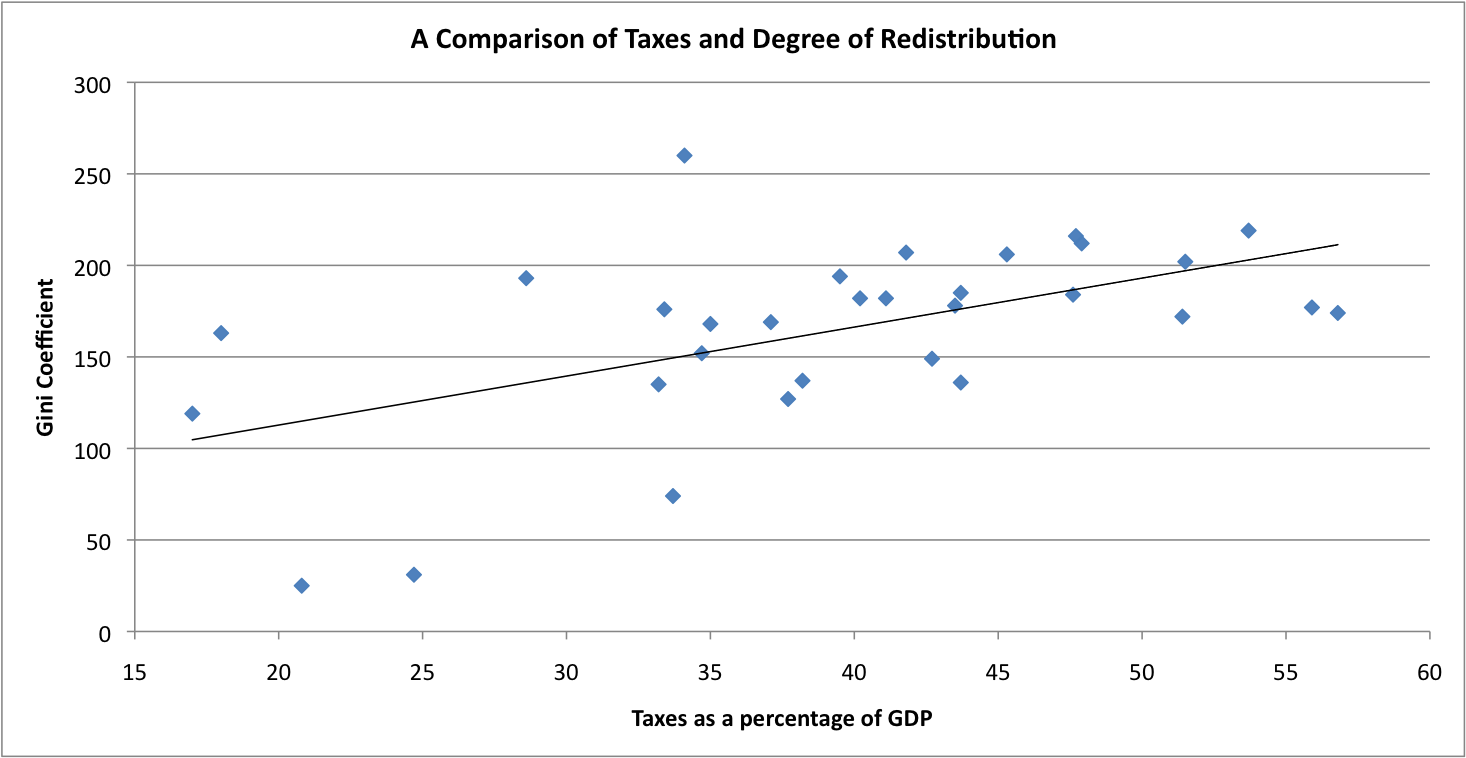
This suggests that there is a connection between higher taxes and more of that tax money going from the rich to the poor. But there is room for error, of course.
Nonetheless, this question about how much of our tax dollars are redistributed is orthogonal to my redistribution metric used above. My chart is not GDP per capita before taxes minus GDP per capita after taxes. Yes, that would tell us more closely how much each person is being taxed, and yes that would raise the question about where those tax dollars go.
My chart is inequality before taxes minus inequality after taxes. it’s not private *wealth* before and after taxes. It’s a measurement of *inequality* before and after taxes. If we find countries that are more equal after taxes are taken out, then that means they redistribute more wealth. If we find countries that are less equal after taxes, then they must redistribute very little (and are probably corrupt). So, it’s not a measurement of where your tax dollars go; it’s a measurement of how more equal or unequal a society becomes when taxed (or in some cases, not taxed). Since it’s measuring relative equality, then we can safely assume that the redistribution is what’s making the difference.
For Fun: As a bit of a side note, here are some other interesting correlations with corruption:
First, richer countries are seen as less corrupt:

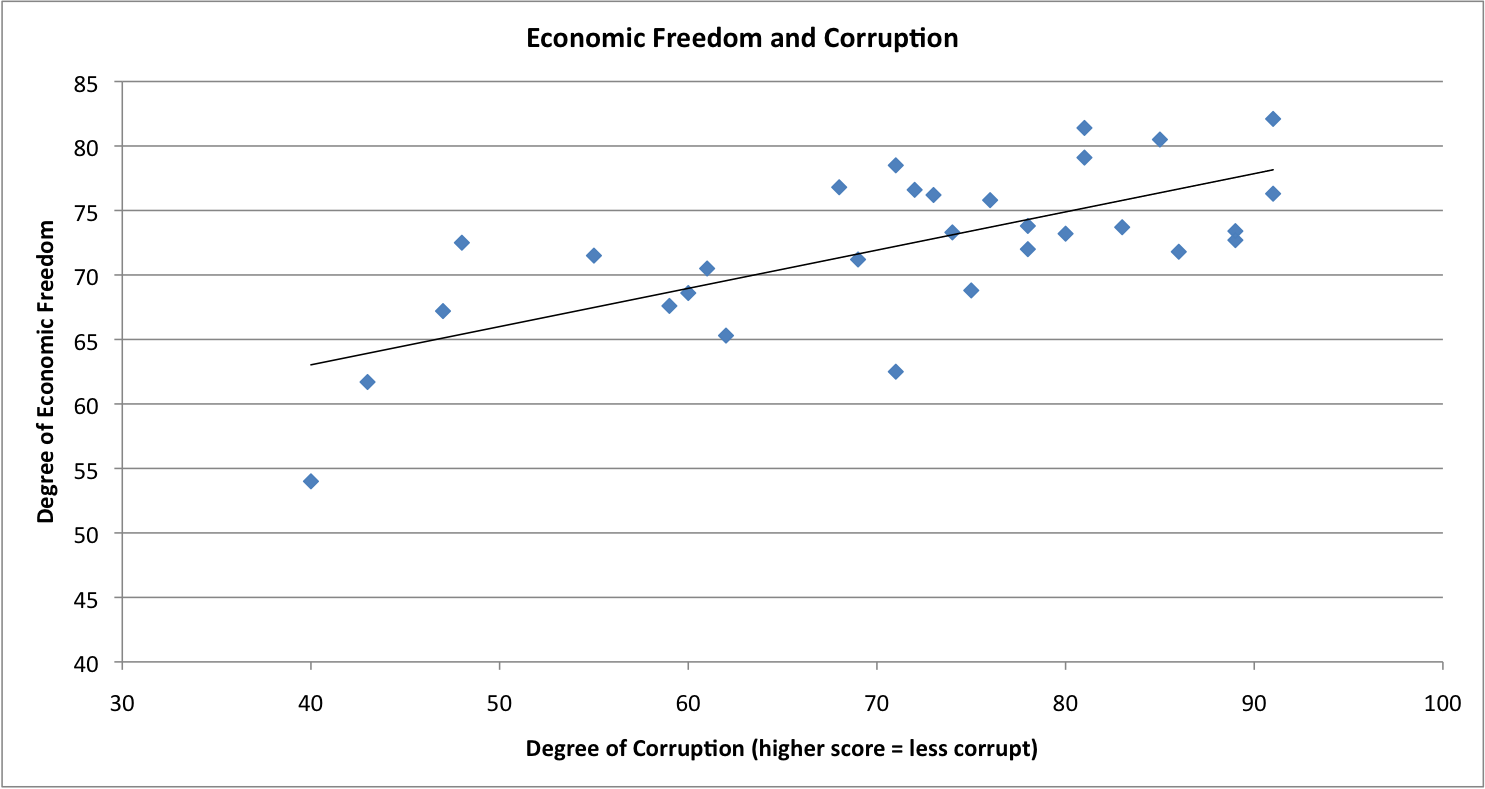
Second, where there is greater economic freedom, there is more trust:
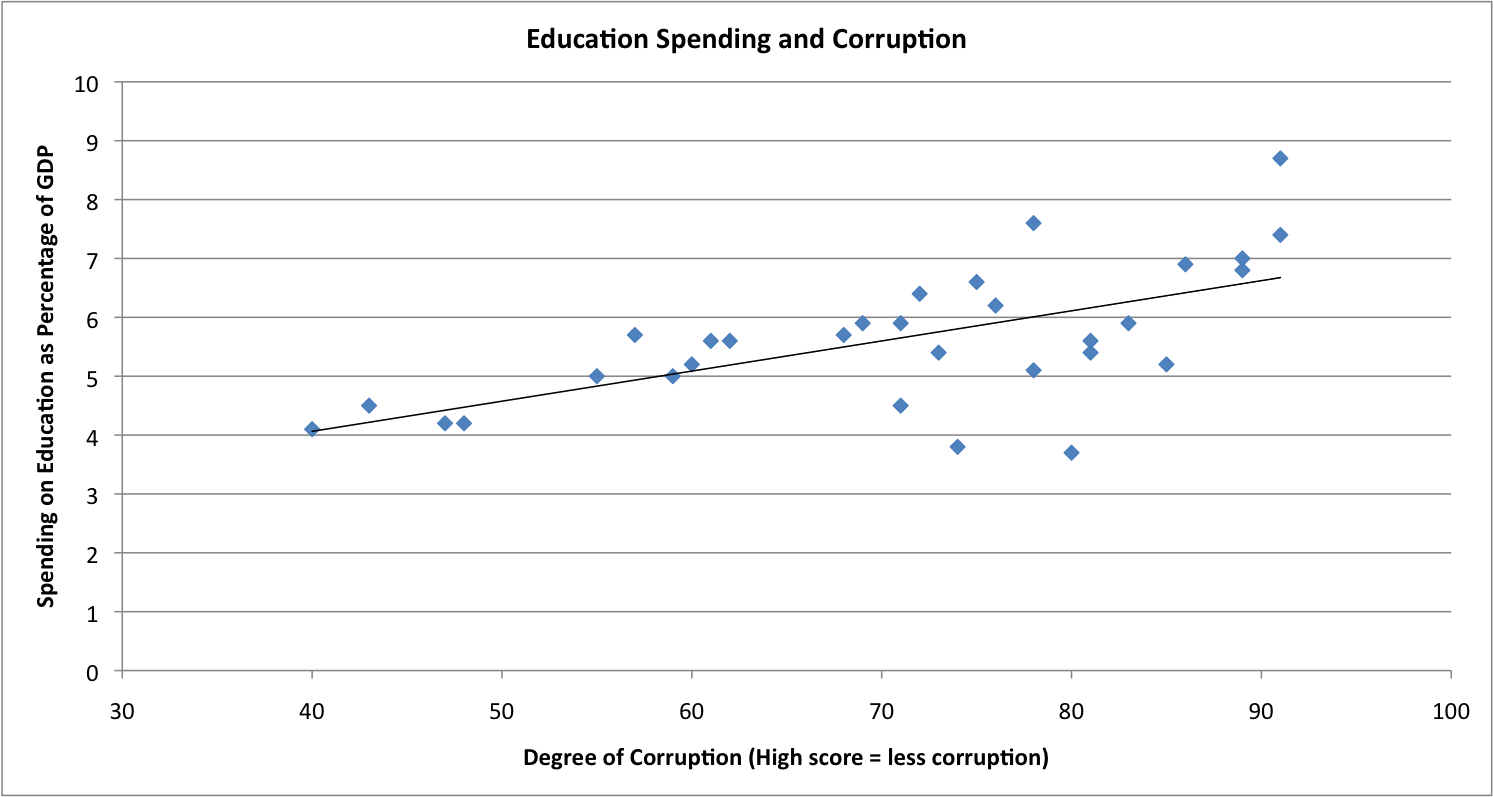
Third, corrupt countries spend less on education:
Fourth, people who live in less corrupt countries are more satisfied with life:

I believe that all of these results are fairly predictable. And I got the same basic results for redistribution as well. All of this suggests that the original data on corruption within societies is a quite good measure of the health of the society.
